The Relationship between Project Management and Quality Control


Having just finished a summer-long course in project management, I am now studying quality management in a Six Sigma Green Belt (SSGB) class.  

I’ve been thinking about the intersection between project management and quality management since I started the started the SSGB class and wanted to sketch out a few of these ideas.

1.  Quality Management => Project Management

One of the relationships between quality management, particularly as done through the Six Sigma process, and project management, is that each quality improvement “experiment” is done as a project.  The Black Belt acts as the project manager of the project, and the Green Belt acts as a member of the project team. 

The project is chartered by the Black Belt with the approval of management or perhaps a Master Black Belt, and it is carried out by the Black Belt who has the Green Belts gather the data.   He or she then

  1. Defines the problem with the process,
  2. Measures the performance baseline data and the variances from it,
  3. Analyzes the root cause of the variances, proposes a solution, and designs an experiment to test it,
  4. Improves the process and verifies the hypothesis that the solution worked, and
  5. Controls to make sure that the solution stays in place.

This is the DMAIC methodology based for quality process improvement.  So each Six Sigma improvement process is run like a project.

2.  Project management => Quality Management

A project manager must manage the quality on his or her project, of course, but managing the cost, schedule, and even scope of the project also take on characteristics of quality management.  Instead of a performance baseline that defines quality, there is a cost performance baseline (i.e., the budget), and a schedule performance baseline (the schedule).   Variances from these performance baselines are monitored or measured at various points in the project, and they are controlled, meaning that any significant variances call for some sort of correction action.  

Since in a project you are often dealing with the output of people, not machines, analyzing and correcting the root cause of a variance may differ from the precisely laid-out DMAIC methodology of Six Sigma.   But the same problem-solving spirit is certainly there as it is in Six Sigma and this is one common point I find between project management and Six Sigma methodology:  they both require a lot of problem solving, a penchant for working with teams, and an ability to get all stakeholders to buy into any proposed solution.

Lean, Six Sigma, Kaizen–what do they have in common?


Today is a short post, an experiment to see if I can post from my mobile phone because my AT&T Uverse high-speed Internet service just collapsed into a black hole of unknown origin, and no technician is available today, so I can’t access the Internet with my desktop computer. Here goes…

In our Six Sigma Green Belt class, these three terms are used and the pre-class discussion is usually how they are related. The high-level view is that Six Sigma is for reducing variability, lean is for reducing waste, and that kaizen is for creating incremental but steady process improvement.

Instead of asking how they are different, let’s turn the discussion on its head: how are they the same, or more precisely what do they have in common?

1. They all involve processes. The process may involve materials, data, or humans (health care), so they have many application areas.

2. They all involve teamwork for implementation. I am probably prejudiced in this regard by having worked for so many years in Japan, but it is precisely the cultural genius of the Japanese for group dynamics that have led them to make so many strides in implementing kaizen and other quality improvement techniques.

3. They all involve quality principles which ultimately derive from the same sources: Deming, Juran, etc. Despite the Japanese cultural spin put on many concepts of kaizen and what is referred to as The Toyota Way, any discussion of the relative superiority of these methods to the “made in the USA” brand of Six Sigma is pointless, in my humble opinion.

Both these “brands” of quality improvement derive ultimately from the same source and the same principles, although they are shaped in their appearance by the culture that has elaborated upon them.

4. They all derive from bottom-up rather than top-down styles of management. Every worker needs to buy in to the process, but doing so empowers each worker to make a change through knowledge and creativity.

5. They all require statistical techniques for proof of their effectiveness. And that is why quality professionals must learn the language of statistics fluently.

So despite their differences, these areas require an overlapping body of knowledge and a similar problem-solving attitude.

Six Sigma Lean Tools and Techniques—Overview of Categories


This post is an overview to the various tools and techniques of lean manufacturing. As I was being introduced to these in my Six Sigma Green Belt class put on by ASQ.

1. Categories of Lean Tools & Techniques

In trying to keep the many tools & techniques straight in my head, I felt that I needed to organize them according to categories.

All manufacturing processes can be broken down into a) non-value-added activities, b) activities which are required by the manufacturing process which I will refer to as “work flow”, and c) value-added activities. You try to minimize a), streamline b), and maximize c). That’s the essence of lean manufacturing in a nutshell as it applies to individual processes.

Then, there are systems of Organization that apply to the manufacturing process as a whole, whose processes consist of categories a), b) , and c).  And finally, you have systems of Improvement which apply to the individual processes AND the entire overall manufacturing process. That is how lean manufacturing operates on a system-wide level.

These categories can be summed up as follows:

Category

Explanation

a) Non-value-added activities Minimizing activities that are non-value-added.
b) Activities required by work flow Streamlining work flow to the greatest degree possible.
c) Value-added activities Maximizing value in value-added activities.
d) Organization Creating a system of organization that supports the tools & techniques in a), b), and c).
e) Improvement Creating a system that improves a), b), c) and d).

The relationship between the categories is probably made a little clearer by this diagram.

Once you understand these categories, it’s time to go through which lean tools & techniques apply to which category. That is the subject of the next post.

Six Sigma Lean Concepts and Tools–Value Stream Mapping


1. Value Stream–definition

The value stream is a series of organizational activities that are performed in a specified sequence. Examples include the flow of raw materials to be processed, the transformation of those raw materials in the process, or the flow of information in a computing process.

The idea is to map these activities and identify and eliminate the waste or muda in Japanese in the value stream in the following way.

First identify all activities involved in the process. Then analyze them according to whether they add value or not. If they do not value, ask if they are required by the process. If they do not value nor are they are required by the process, then they should be eliminated.

Activity Type Eliminate?
1. Adds value as perceived by the customer NO
2. Adds no value, but required by the process NO
3. Adds no value YES

2. Value Stream Mapping

There is a tool for for eliminating waste or muda in the value stream, and that is value stream mapping.

Mapping Step Description Symbol used
1. Map suppliers and customers


Symbolize suppliers that feed production inputs, and customers that receive production outputs.


2. Map process steps Symbolize every process on the production path of the material or information. (Lower part of box is for cycle time, batch numbers, etc.)
3. Map storage/ inventory steps


Symbolize steps between processes where material/information is stored.


4. Analyze process steps


Analyze process steps: either it is value-added (VA), or non-value-added (NVA).


NVA or VA
5. Draw value-added timeline


At bottom of map, put timeline underneath processes showing time for both VA and NVA activities.


6. Future state map


Redo the present state map eliminating those NVA process steps that are not required by the process.


(all of the above)

3. Value Stream Mapping Example

(The above diagram was taken from www.rff.com, RFF Electronics, a company that produces professional charting software for flowcharts, organizational charts, etc.)

Step 1. Supplier/Customer

The supplier is denoted by the yellow symbol, and this is brought weekly to the Acme Production company (denoted by the truck symbol) where it is an input to the process. When the widgets (or whatever it is Acme Production is producing) are finished, they are shipped daily to the customer, who is denoted by the pink symbol.

Step 2. Map Process Steps

The company does a monthly forecast of the customer demand, which then causes production control to order the production supervisor to make the parts on a weekly basis. The input is a) machined, b) inspected, c) packaged, and d) shipped as an output. Each of these four production steps is indicated by the rectangular box with the label of the process on top and the specific information about the process (CT = cycle time, batch size, uptime, IGO).

Step 3. Storage/Inventory Steps

Storage and/or inventory steps before processing or between processes are those denoted with the triangle above.

Step 4. Analyze Process Steps

Obviously the process steps are value-added, and the inventory or storage steps identified in Step 3 above are non-value-added.

Step 5. Draw VA/NVA timeline

In the above example, please note that the timeline has the value-added activities on the bottom lines and the non-value-added activities on the top lines, the opposite direction as indicated in the chart. It is important that it is clear to the organization which is which.

Step 6. Future state map

This example is a CURRENT state map; if the inventory or storage steps were reduced as much as possible, then a redrawing of the production path with the reduced NVA steps would be the FUTURE state map.

4. Conclusion

There are many other symbols used in the Value Stream Map, but the ones listed above are the basic ones that you must understand to be able to comprehend such a map. Agan, the purpose of such a map is to minimize non-value added activities. There are additional lean techniques, which will be discussed in the next post.

Why Repeat an Award Level at Toastmasters International?


Last night there was a Division Council Meeting for Division D of the Founder’s District. I’ve been in Toastmasters close to two years now, and I’m always amazed at how I constantly learn new things about how the organization works when I go to meetings involving the leaders of that organization.

Last night I learned something which I will put into practice right away, and that is a concept of repeating an award level at Toastmasters International. To explain this, I first have to explain what an award level is. Starting as a beginning Toastmaster from the bottom of the diagram below, you enter the Educational Track (on the left) and the Leadership Track (on the right).

1. What is an award level?

Fig. 1 Educational and Leadership Award Levels at Toastmasters International

To get the Competent Communicator award, the one indicated at the bottom left of the above diagram, you have to do 10 speech projects. To get each level higher than this, which go in the sequence Bronze, Silver, and Gold, you need to do an additional 10 speech projects and some additional projects which strengthen your club’s communication abilities (at the Silver level) or even being a mentor for another club (at the Gold level). This latter project can often takes several months to complete.

To get the Competent Leader award, the one indicated at the bottom right of the above diagram, you have to do 10 leadership projects. Each of the leadership projects consists of performing several support roles within the club, from the simplest (timer, vote counter) to the most involved (Toastmaster, the “Master of Ceremonies” of the meeting). At the Bronze and Silver level you have to get experience being an officer of the club (at the Bronze level) and the area or division that club is in (at the Silver level). You also have to do a High Performance leadership project, which can take several months to complete. Note that there is no “Gold level” for the Leadership track, just for the Communicator track.

Then when you get to the highest level of both tracks, you are then qualified to become a Distinguished Toastmaster or DTM , which is the highest award level you can reach at the club level.

2. Why repeat an award level?

Now I can explain why you might want to repeat an award level. Essentially you are repeating a lower level while still progressing at the higher level of each track. Here’s why this is a good idea:

Reason #1: Head start on your next DTM

After you become a Distinguished Toastmaster, what do you do then to improve your speaking and/or leadership skills? You can reach outside of your club and try to become involved at the Division or even District level of leadership, but within your own club, you can essentially start going up the ladder again and start earning another Competent Communicator award by doing speeches and another Competent Leader award by performing support roles at the club.

The Advanced Communicator Gold and Advanced Leader Silver projects can take several months, as I indicated before. I originally thought you had to complete everything for your Distinguished Toastmaster or DTM award BEFORE you could start up the ladder again. It turns out that is not the case, as I learned last night.

On the communicator side, you can start a Competent Communicator award by doing the same 10 speeches from the manual of that same name before you complete your Advanced Communicator Gold, Silver, or even Bronze award. And on the leadership side, you can start a Competent Leader award by doing the 10 leadership projects from the manual of that same name before you complete your Advanced Leader Silver or even Bronze award.

At the Founder’s District Conference last Saturday, Roberta Perry, the former International Director for Region 10, made a suggestion for advanced Toastmasters on how to use the Competent Communicator or CC manual to really challenge yourself.   You take the CC manual to the club, and when it is your turn to speak, the Table Topics master gives you a topic, and the Vice President Education picks one of the 10 speech projects out of the manual, and you have to do an impromptu 5-7 minute speech on that topic and using that particular speech project.    It’s like Table Topics on steroids.  That’s just one suggestion; most people just try to do the same 10 speech projects but with a greater mastery to detail than they gave it the first time around.

Now let’s say you’ve completed your Competent Leader or CL award and you are a club officer. This means all you have to do to get your Advanced Leader Bronze award is do two presentations on leadership to your club. In the meanwhile, you will probably be doing support roles at your club if you are not the speaker or evaluator that evening. So why waste a perfectly good set of opportunities?  Start a new CL manual and gain credit for it now!

That means that the time it takes to complete your DTM the second time around could be cut in half!

Reason #2: Help a second club

If you are a member of two different clubs, you are considered a dual member. The rule is that when you gain an award level and earn that new designation (CC, CL, or whatever), your club gains credit for your achievement through something called the Distinguished Club program. If you are a member of two different clubs, only one club can take the credit for your achievement. So you should tell the Vice President Education of each of your clubs AHEAD OF TIME which club you plan to assign the credit to.

But if you do a second CC or CL manual, you can then give the achievement to the second club, which they will appreciate as supporting their own Distinguished Club plan.

Reason #3: Seize the day and take the opportunity!

This gets down to the real reason for repeating an award. To paraphrase the song “Every Breath you Take” by Sting, “every speech you make, every role you take, you’ll be helping you” … and your club.

So although I just completed my Advanced Communicator Bronze and am working on my Advanced Leader Bronze, I’m going out and getting a new Competent Communicator and Competent Leader manual today!

5 Global Risks the Next US President Must Contend With #WEF


I went to the polling place this morning here in Anaheim, CA, hosted by a local elementary school in order to cast my vote in the US national, state, and local elections. As I left after having cast my vote, parents were dropping their children off to the school. This made me think about how the decision to be made in the next 24 hours about the US Presidency will affect not just my life, but eventually the lives of those children as well.

Earlier this year, I had written a blog post about the future trends identified by the World Economic Forum or WEF, and I thought of posting something today to recap these trends as a way of reminding people at what is at stake. It occurred to me that whoever wins the US Presidency will have to deal with these global trends, and any hope for the future is tied up with how well they handle them over the next 4 years.

1. Introduction

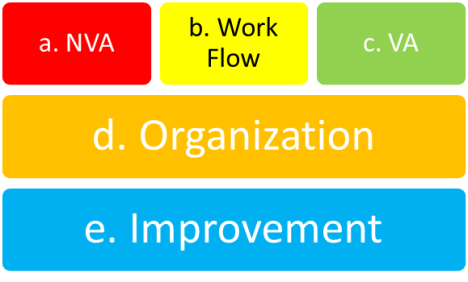
The World Economic Forum held in Davos, Switzerland puts out a Global Risk Report every year which outlines global risks in 5 categories, which are given below in a color-coded list.

Fig. 1 Global Risk Categories

2. Most Likely Global Risk Factors

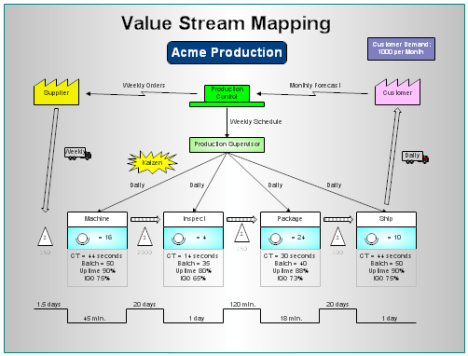
The seventh edition of the Global Risk Report ranks the 50 global risk factors according to their a) likehihood and b) impact on a scale from 1 to 5, with 1 meaning “least likely or severe” and 5 meaning “most likely or severe”. Below are the global risk factors thought to be the most likely to affect the global community in the near future.

Fig. 2 Most Likely Global Risk Factors

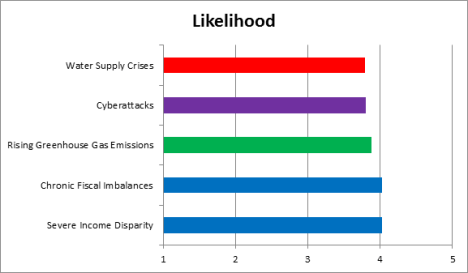
a. Severe Income Disparity

This creates political pressure on governments to step in and correct this perceived imbalance, and can be a factor pushing political extremism. In the United States, it has led to the Occupy Wall Street movement on the left and the Tea Party on the right, both of which were created in protest of the bailouts of the financial sector by the US Government in 2008. If another bailout is required due to the failure of big banks in wake of a possible breakup of the Eurozone, there will be a lot of populist pressure in the US against another set of bailouts.

b. Chronic Fiscal Imbalances

There is pressure on the US government to reduce debt, but austerity measures which reduce government spending also have the side effect of reducing economic demand, as has been found by the governments of Europe. The US has avoided the extreme economic austerity measures tried in Europe, and has as a result avoided the economic contractions experienced there.

The negotiations regarding the so-called “fiscal cliff” in January 2013 may result in polities which increase these chronic fiscal imbalances.

c. Rising Greenhouse Gas Emissions

Hurricane Sandy shows that the economic cost of rising greenhouse gas emissions will continue to grow. There is an incentive for large companies involved in fossil fuel extraction to downplay the risks because they fear that regulations to curb greenhouse gas emissions may impede their ability to extract these resources and thus to make profits. However, insurance companies may become increasingly vocal about how paying for damage due to weather-related disasters effected by rising greenhouse gas emissions will affect their ability to make profits. Two areas the President can most effect this risk are in formulating energy policy and in infrastructure spending to repair and to prevent damage due to extreme weather events. However, the ability for the US government to engage in this infrastructure spending is tied up with the negotiations mentioned above in paragraph b).

d. Cyberattacks

Comparing the global risks identified in the seventh edition of the Global Risk Report http://www.weforum.org/reports/global-risks-2012-seventh-edition to those identified in previous reports, this is the first time in over five years that a technological risk (Cyberattacks) has been identified . These cyberattacks take the form of attacks by a) government vs. government, b) government vs. individuals or corporations and vice versa and c) corporations vs. corporations. The US President will have to make sure that the Department of Homeland Security pays sufficient attention to the threat of cyberattacks from foreign governments. He will want to strengthen the hand of the US Government to have access to privately held information from both corporations and individuals for security reasons without depriving those same individuals of their rights guaranteed by the very Constitution the US Government is allegedly supposed to uphold. That is a very fine needle to thread.   The US government should try to make sure it does not get used in the attacks of one set of corporations by another, as are threatened by laws that would essentially have the government be the guarantor of private copyrights of entertainment corporations or the monopolistic control of corporations which distribute entertainment, at the expense of other corporations which survive on a model of the free flow of information (so called “net neutrality laws”).

e. Water Supply Crises

As a side effect of the global risk in paragraph c, drought in many areas of the US is driving up food commodity prices, which in turn distorts the market for alternative energy subsidies that encourage the diversion of food crops to produce biofuels. Attention will have to be paid to regional water agreements such as those on the West Coast that they do not unravel in the face of continued droughts.

3. Most Severe Global Risk Factors

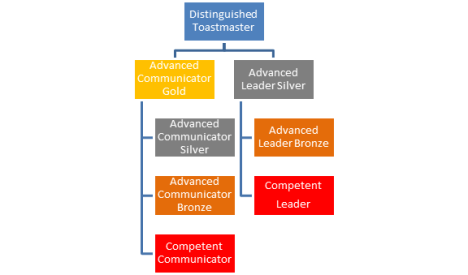
Fig. 3 Most Severe Global Risk Factors

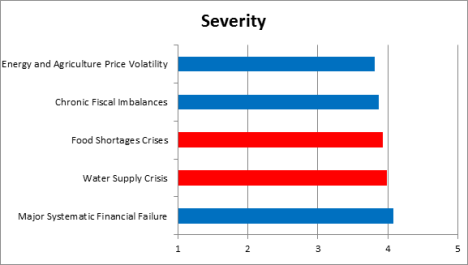
a. Major Systematic Financial Failure

The biggest concern here is the Eurozone when it unravels. Will it be a controlled implosion or an explosion of panic? Even if it is a controlled event, the US financial markets are so invested in the Eurozone that one or more banks may not survive the collapse. If so, will the US Government bail out those banks one more time? Whichever President does will save the financial sector at a great political cost in the next election.

b. Water Supply Crisis and c. Food Shortages Crisis

This was dealt with above in the section on “likely” risks. Droughts will cause a food shortage crisis, and increase the need for those on food stamps and other financial aid from the government to survive. However, there is simultaneous pressure on the President to cut domestic programs including food stamp programs as part of the negotiations to reduce the Federal budget.

d. Chronic Fiscal Imbalances

This is also on the hit parade of most likely global risks (along with water supply crises), so the President has to take a stand on reducing the deficit in the medium to long term without introducing austerity measures that will increase the deficit in the short term and increase political instability as well.

e. Energy and Agriculture Price Volatility

Remember that the Arab Spring, although taking the form of political revolution, had its origins in the economic depression faced by these countries that was exacerbated by rising fuel and food costs. Droughts will increase agriculture price volatility, and any move which politically destabilizes the Middle East will increase energy price volatility.

In the case of a potential attack by Israel against Iran’s nuclear facilities to prevent them from producing nuclear weapons, the US has so far restrained such an attack because the decrease in the perceived risk to Israel might be offset by the increased geopolitical risk in the Middle East that such an attack might set off, plus the risk to energy price volatility that such an attack would definitely set off.   Will such balancing of risks continue after the US presidential election is over?

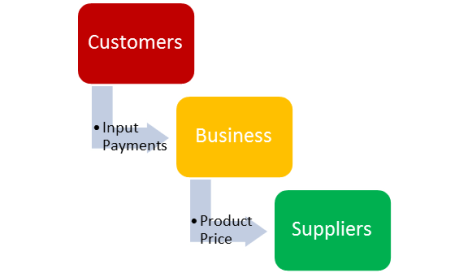
4. Interaction of Global Risk Categories

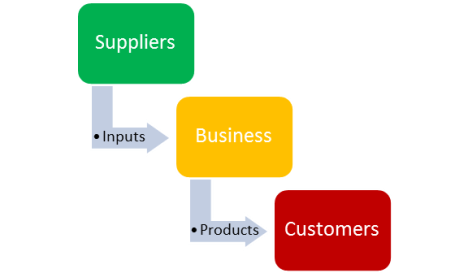
The diagram shows how these five global risk categories link up to each other. The technological risk of cyberattacks is part of a more generalized “critical systems failure” risk, and the societal risks of water and food shortages, are subsumed under “unsustainable population growth.”

Fig. 4. Global Risk Centers and How they Interact

You will notice that all of these categories of risk connect to the geopolitical risk of “global governance failure.” The task of the next President will be to make wise decisions that reduce this geopolitical risk of global governance failure by being part of the solution, and not exacerbating the problem. That is what is at stake in today’s election.

Six Sigma Lean Concepts and Tools—Value, Value Chain and the Value Stream


1. Value

The concept of value is an important one in lean production. Value is the customer perception of the usefulness & necessity of a given product or service at a target cost based on competition and elimination of waste by lean methods.

2. Value Chain

The value chain connects both business-to-business operations and business-to-customer relations in the following way. In the value chain, the production flows from inputs that suppliers send to businesses, which then process them into products, which are bought by customers.

Fig. 1 The Value Chain–Production Flows


This engine of growth is fueled by the monetary flows going in the other direction, from the product price paid by the customers to the business, and the input payments paid by the business to the suppliers.

Fig. 2 The Value Chain—Monetary Flows


3. Value Stream

The value stream is a series of organizational activities that are performed in a specified sequence. Examples include the flow of raw materials to be processed, the transformation of those raw materials in the process, or the flow of information in a computing process.

The idea is to map these activities and identify and eliminate the waste or muda in Japanese in the value stream in the following way.

First identify all activities involved in the process. Then analyze them according to whether they add value or not. If they do not value, ask if they are required by the process. If they do not value nor are they are required by the process, then they should be eliminated.

Activity Type Eliminate?
1. Adds value as perceived by the customer NO
2. Adds no value, but required by the process NO
3. Adds no value YES

The next post goes into some more details about the value stream map and analysis.

Creative Inspiration–a presentation by Craig Kausen, grandson of Chuck Jones #chuckjones


This post is a summary of a presentation that Craig Kausen gave at the Founder’s District Toastmasters Conference on November 3, 2012.  His presentation was in three parts: introducing himself, talking about his grandfather’s work, and then discussing how it illuminates the phenomenon of creativity.

1. Craig Kausen’s bio

Craig first introduced himself. He graduated with a Computer Engineering degree from UCLA, became a computer design engineer, and taught for a decade as a college instructor. He helped establish The Chuck Jones Galleries, three of the most highly respected animation art galleries in the U.S., to showcase his grandfather Chuck Jones’ work and the work that he inspired.

In 1999, he formed the Chuck Jones Center for Creativity, a non-profit educational organization located in Costa Mesa, CA. The Center’s vision is to inspire the innate creative genius within each person that leads to a more joyous, passionate, and harmonious life and worldas it states on their website chuckjonescenter.org.

I’m sure the question that was each audience member’s mind was: what was it like being the grandson of a fun, creative genius like Chuck Jones? Craig told the following story. His grandfather Chuck Jones knew a lot about animal anatomy from having sketched so many different “critters” over the years, albeit in exaggerated form. One of the places he liked to take his grandsons was Sea World down in San Diego, CA. On one occasion, he went down to make sketches of sea lions. After their return to the Los Angeles area, his grandfather wondered, given the limitations of movement that having flippers rather than hands entails, how a human would be able to move in the water. He decided to do an experiment that involved his two grandsons, one of them being Craig. When I say “involved”, I mean really involved. He had their arms and legs tied with sections of rope to restrict their movement, and then threw them in their backyard pool to see how they would be able to swim.* Indeed, the movements that they made to get across the pool from one side to another exactly mimicked the characteristic movement of sea lions, demonstrating the evolutionary pressures responsible for them.

*As Craig reassured us while telling us this story, no grandsons were harmed in the course of this experiment!

2. Chuck Jones bio

Chuck Jones became an illustrator because his father was an unsuccessful businessman and kept purchasing new stationery and new pencils each time he would try one more failed attempt at a new business venture. To use up them up, he insisted that his children, Chuck and his two older sisters, draw every day. After Chuck was in art school, the art professor told the class that each of them had 100,000 bad drawings in them that they would first have to get out of their system before they would produce anything worthwhile. This was an immediate relief to Chuck because he figured he had done at least twice as many on his father’s seemingly endless supply of stationery!

Craig expressed a couple of themes about his grandfather that remained true throughout his life. He was tenacious, and that tenacity can be seen as a hallmark characteristic of one of his most celebrated cartoon creations, Wile E. Coyote. He was, of course, creative, which can be seen as a characteristic of Bugs Bunny in the ways that he thinks of creative ways to overcome foes and adversity. He was also a teacher, in that he knew how to take the creative strengths of others who were aspiring animators and to inspire them to tap their own creative wellsprings.

During one of the breaks, I asked Craig about this because I had just coincidentally watched the night before the presentation a biography of Mel Blanc, who was to the voice characterizations of the Warner Brothers cartoons what Chuck Jones was to the animation. Craig said that, although his grandfather knew he was a good illustrator and animator, there were many involved in the various aspects of making a cartoon that were much better at their job than he could ever be (like Mel Blanc, for example), so Chuck Jones allowed an open mode of discourse with them that made their best work shine forth as well.

Many of these aspects of Chuck Jones’ biography were explained by Chuck Jones himself in the form of short clips of biographical interviews that had been conducted later in his life, that Craig would later expound upon.

3. Creativity

Creativity comes from a place of natural intelligence within us that comes forth like a clear signal when the “noise” of the daily chatter of the mind is stilled. The mind has an outer layer and an inner layer as seen in my rendition of the drawing Craig drew on the whiteboard. The outer world is stimulated by all the impressions of the outer world, which it receives constantly. It processes the stimuli of the outer world, and from this, the inner mind does the real work of breaking down and recombining down those thoughts of the outer mind and coming up with something new, something creative.

The problem is that, if the outer mind is too turbulent, denoted by all the vertical lines in the diagram below, this becomes noise which drowns out any creative signal which the inner mind may have produced. So you have to learn to quiet the outer mind and let the creativity come through. This is why people say they get creative thoughts at times like a shower, or while walking, or in the case of Einstein, while riding the train to work. The quieted outer mind finally lets the creative emerge from the inner mind.

        Fig. 1 Creativity, the Outer Mind, and the Outer World

4. Conclusion

Craig said that he has learned to appreciate Einstein’s thoughts on creativity, including his statement “imagination is more important than knowledge.” Perhaps in honor of Einstein as a physicist, he started to write an equation on the board that started with E, but it was not E = mc2. It was

E = (knowledge + understanding + experience) creativity

E is your effectiveness in your chosen profession. Yes, knowledge which leads to understanding is important, and this will lead to a body of experience. But creativity, like the exponential in the above equation, is what really will take your profession to astronomical heights. Without it, you’ll just be like Wile E. Coyote, chasing that Road Runner of inspiration.

It was a wonderful talk and a creative way of looking at the subject way of creativity. He expressed some nervousness about doing a two-hour presentation in front of Toastmasters, who are devoted to the art of public speaking, but I thought he did a tremendous job. Right after the talk, I and another person who belongs to my club were inspired to go and share a brainstorming session on five creative ways we could help our club to grow. I will look into the Creativity Center and try to get more involved, because I think creativity is a vital yet overlooked quality of being a truly inspirational leader.   It’s something we need to pay attention to, especially as Toastmasters, since the new branding slogan of Toastmasters International is “Where Leaders Are Made.”   Maybe we should change that to “Created”!

Fun at the Founder’s District Conference


Today I went to the Founder’s District 2012 Fall Conference for Toastmasters International. I thought I would recount a bit of what went on so as to give non-Toastmasters and Toastmasters who have never gone to such a conference a taste of what the fun is all about.

1. Registration—time to network! (8:00 AM-8:45)

The first part of any Toastmasters Conference is the opening registration, where people get their conference programs, pick their seat in the conference meeting hall, and network with other Toastmasters.

I once heard someone say they didn’t go to District Conferences because they were afraid it would be too “cliquish”, in other words, that they wouldn’t feel welcome. I can attest to the fact as a former introvert that this is simply not true, at least for the Founder’s District. There are some extroverted people in Toastmasters with whom it is easy to establish a rapport. The introverted ones may take a second or third meeting before they feel comfortable about approaching you in the future. But as far as you approaching them is concerned, I have never felt like I was being given the “brush off” whenever I went up to a Toastmaster and introduced myself.

2. Welcome and Humorous Speech Contest—time to laugh! (8:45-10:30)

Victoria Dotson, the Founder’s District Governor, opened the meeting and quickly gave the meeting over to Carolyn Bramlett, who was the Contest Master in charge of the Humorous Speech Speech.

There were 8 contestants, one each from the 8 Divisions in the Founder’s District. I was rooting for those in the Divisions of my clubs (C and D), of course, but listened attentively to all 8. One part of me was laughing at the funny and touching parts of each of the speeches, but I had an “evaluator” track going in my mind at the same time, trying to give my own private “ranking” of who I thought did the best job. But I learned something about technique from every single speaker.

3. Business Meeting—time to be serious! (10:30-11:30)

After the speech contest, there was a business meeting in which the past Conference meeting minutes were approved, various Divisions reported how things went in 2012, and there was a call for new business. There was none, so we skipped to the real important business of … lunch!

4. Contest Winners, Keynote Speaker, Club and Member awards—time for inspiration! (11:30-1:45)

During lunch, the contest winners were announced:

  1. Daniel Midson-Short, who did a speech on myths about Australia
  2. Charlie Cheatham, Jr., who did a speech on his imagined sports heroism
  3. Aneeza Haleem, who did a speech on being liberated from women’s liberation

I ended up in my own mind picking two of the same winners that the Judge’s picked. The approached the one person whose speech I thought should have won but didn’t how much I appreciated his speech and his effort.

Then Roberta Perry, the immediate past International Director for Region 10, gave a speech on experimental leadership. The message of her speech is that you need to create an environment in which people whom you lead feel okay with taking risks and trying new things.

Finally, those clubs and members who had achieved great things in the past year were recognized. It was so inspiring to see the 11 people who achieved the highest honor of the Toastmasters International educational and leadership tracks, the Distinguished Toastmaster award. I kept thinking “that’s going to be me in some day!”

5. Workshops—time for learning! (2:00-4:00)

There were two workshops being put on, and I chose to go to the one put on by Craig Kausen, grandson of Chuck Jones, the legendary creator/animator of such cartoon characters as Bug Bunny, Pepe le Pew, and Wyle E. Coyote. His topic was “Creative Inspiration”, and he told the story of his life and that of his grandfather in the first half, to show the creative wellspring that runs in his family. In the second half, he discussed the nature of creativity and his involvement with the Creativity Center, a non-profit education organization located in Costa Mesa whose vision is to inspire the creative genius in each and every one of us.

I ended up talking with a fellow club member who saw the same presentation, and we spent a half hour thinking of creative things we can do to improve our club!

So, between the networking, awards, contests, accolades and workshops, I had a wonderful time and will be on a “Toastmasters high” for the next weeks. For those of you Toastmasters who have never been to a District Conference, I urge you go because your mind will gain a larger vision of the future than you had going in!

Six Sigma and the Mysterious “1.5-Sigma Shift”


As I mentioned in my previous post, sometimes the most interesting discussions in our Six Sigma Green Belt class occurnot in class, but before the class has started when everybody has not yet arrived and those who have arrived ask the instructor questions on what they have read over the previous week.

A couple of weeks ago, I came across something called the “1.5-Sigma Shift,” a mysterious phenomenon whereby companies are only achieving 4.5 Sigma on the average when they are trying to achieve Six Sigma. I asked our instructor Bob Mehta about this, and here’s his reply.

1. Theory one: Long-term “drift”

The one theory is that a Six Sigma project may achieve a short-term quality improvement, but then this fades over time so that the system drifts back towards its previous state with poorer quality. The reason for this could that long-term habits of equipment operators, etc., may cause the system to revert to its earlier state even if there is short-term improvement.

2. Theory two: Root cause not identified

The second theory is that a Six Sigma project may achieve a short-term quality improvement, but then this is overshadowed by other forces which cause poor quality. The reason for this is not because of an equipment operator’s error, but rather that the design improvement caught one of the causes of the quality problem, but not necessarily all of them, and most importantly, not the root cause of them. So one “symptom” has been cured, but not the underlying “disease”, to put it in medical terms.

In our class discussion, we came to the conclusion that quality engineers might tend to pick theory one as the reason for the 1.5-Sigma drift because it puts less of the blame on them as compared to theory two.  At any case, it does show the importance of not taking any quality improvements achieved in the past for granted, but reviewing and revisiting them from time to time.

It was great to have such a candid discussion with our instructor.