5th Edition PMBOK Guide–Chapter 8: Affinity Diagrams


In the last post, I discussed the inputs, tools & techniques, and outputs of the process 8.2 Perform Quality Assurance.  The main set of tools are the 7 Quality Management Tools:   Affinity Diagrams, Process Decision Program Charts or PDPC, Interrelationship Digraphs, Tree Diagrams, Prioritization Matrices, Activity Network Diagrams, and Matrix Diagrams.   These tools are so important that I have decided to write a post about each of them in turn to explain more about them.

The first Quality Management tools listed is that of affinity diagrams. I am indebted to the Project Management Hut (http://www.pmhut.com) for their lucid explanation in addition to, of course, the 5th Edition PMBOK® Guide.

1. What is an affinity diagram?
It is a brainstorming tool, developed by Jiro Kawakita in the 1960s, which is why it is sometimes referred to as the “KJ Method” (in Japanese, last names are listed first).

It is a way of taking a series of facts, ideas, or data on a certain general theme and organizing it into groups of clusters based on their natural relationship or affinity.  It can be the first step towards a cause-and-effect analysis using an Ishikawa or fishbone diagram.   The 5th Edition PMBOK® Guide mentions that it can be used in project planning during the creation of the WBS generate ideas about how to decompose the scope into work packages.

2. How does it work?

You get the various stakeholders who are involved on a problem to get together. You buy a lot of variously colored post-it notes or 3×5 cards which are the “atoms” of facts or ideas that you are going to assemble into the various groupings.

Here’s the steps you take:
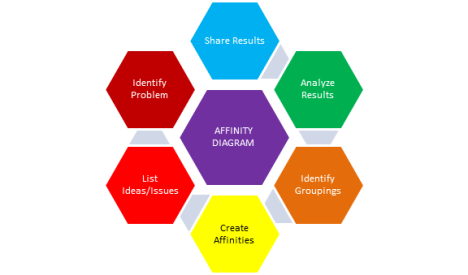
Step Description
1. Identify Problem Define your problem or identify a general theme. Example: why has customer satisfaction rate been declining?
2. List ideas/issues List the relevant facts, data, ideas, opinions regarding the subject and put these on the post-in notes or index cards. Post these on a noteboard or blackboard.
3. Create affinities Notice which of these notes or cards are similar and arrange them according to patterns based on those affinities.
4. Identify Groupings Label each group of similar notes or cards with a label for each Affinity group. These could be aspects of the problem under consideration. Prioritize these problems that have been identified.
5. Analyze Results Look at the overall groupings created and the facts/ideas associated with each. What insights does this create with regards to the problem stated at the beginning? Does it suggest potential solutions?
6. Share Results Share the results with the stakeholders at large.

For an example of how this would work with a real-world problem, please go to the following website because I thought they did a great job showing the various steps I outlined above.

http://www.mindtools.com/pages/article/newTMC_86.htm

In conclusion, the affinity diagram or KJ method is a way of synthesizing data and allowing natural patterns to emerge, which allow you to approach the problem in a more organized and systematic way in order to create a more comprehensive solution.   They can be used in conjunction with other quality tools such as the fishbone or Ishikawa diagram to uncover the potential causes of a quality problem.

Advertisement

5th Edition PMBOK® Guide: Chapter 8: Process 8.2 Perform Quality Assurance


This post gives an overview of the second of the three processes in the Quality Management Knowledge Area, namely process 8.2 Perform Quality Assurance, by listing the inputs, tools & techniques of the process, and the outputs.   Perform Quality Assurance belongs to the Executing Process Group, and focuses on the processes, while Perform Quality Control (in the Monitoring & Controlling Process Group) looks at the product or deliverable itself.

1.  Inputs

The first three of the inputs listed for this process are outputs of the planning process 8.1 Plan Quality.  The fourth input comes from the monitoring & controlling process 8.3 Perform Quality Control.


8.2 PERFORM QUALITY ASSURANCE
INPUTS
1. Quality Management Plan Describes the quality assurance approaches for the project.  This is an output of process 8.1 Plan Quality.
2. Process Improvement Plan Describes the continuous process improvement approaches for the project.  This is an output of process 8.1 Plan Quality.
3. Quality Metrics Provides the attributes to be measured and the allowable variations.  This is an output of process 8.1 Plan Quality.
4. Quality control measurements The output of activities from process 8.3 Perform Quality Control.  These measurements are used in this process to analyze the quality of the processes.
5. Project documents Should be monitored in this process in the context of configuration management (so all project team members work from the same version of the project documents).
TOOLS & TECHNIQUES
1. Quality management and control tools The same tools & techniques used in process 8.1 Plan Quality and 8.3 Perform Quality Control are used in addition to the following seven tools:

  • Affinity diagrams
  • Process decision program charts (PDPC)
  • Interrelationship digraphs
  • Tree diagrams
  • Prioritization matrices
  • Activity network diagrams
  • Matrix diagrams
2. Quality audits An organized process that asks the question:  do the project activities conform to the organization’s quality policies, processes, and procedures.  All good practices that conform are identified and put in the lessons learned; those practices that don’t conform are corrected.
3. Process analysis Identifies needed improvements in processes and preventive actions needed through root-cause analysis.
OUTPUTS
1. Change requests All requests for changes that result from an audit are then input into process 4.5 Perform Integrated Change Control under Integration Management.
2. Project management plan updates The following component plans are updated:

  • Quality management plan
  • Scope management plan
  • Schedule management plan
  • Cost management plan
3. Project documents updates
  • Quality audit reports
  • Training plans
  • Process documentation
4. OPAs updates
  • Organization’s quality standards
  • Quality management system (guidelines, policies, procedures)

2.  Tools & Techniques

The seven quality control tools listed are used in addition to those quality tools already listed for the other two processes in Quality Management, 8.1 Plan Quality and 8.3 Perform Quality Control.

I have reviewed all of these techniques in the context of my blog posts on Six Sigma, but for the next few blog posts, I will repurpose these blog posts, because the tools are very useful for Quality Assurance.

3.  Outputs

Since the main question asked by quality audits is whether the project activities conform to the organization’s quality policies, processes, and procedures, if the answer to the question is “no” for some of those activities, they will need to be changed to bring them into conformance.  Those change requests are the first output of this process, which then get fed into the process 4.5 Perform Integrated Change Control.

The quality management plan may be updated as a result of these audits, and the results of the quality audits will be conveyed to the project team and the relevant stakeholders as another output of the process.

The next post will cover the Cost of Quality, because this is important in now only educating stakeholders in why quality activities are being undertaken, but in setting the level of quality for a project.

The next post will cover the seven quality control tools used as part of this process.

5th Edition PMBOK Guide–Chapter 8: Perform Quality Assurance vs. Perform Quality Control


1.   Introduction

The last posts covered the inputs and outputs, as well as some of the tools & techniques of the first quality-related  process, 8.1 Plan Quality.   I was planning on going on to the second quality-related process, 8.2 Perform Quality Assurance, but then it occurred to me that I ought to do an overview of the difference between that second process and the third one, 8.3 Perform Quality Control.

In managing study groups for now two groups of students studying for the CAPM and PMP, the difference between these two processes seems to be a little unclear to many encountering it for the first time.   The reason why is that Assuring Quality and Controlling Quality seem to have the same end in mind, that is, to make sure the quality of the product or project matches what was set forth in Plan Quality, isn’t that right?   Well, the end is the same, but the focus is different.   This post will try to explain why using an analogy to baking.

2.  Quality Assurance vs. Quality Control

The first process is in the planning process group, which should be obvious from the name.   However, the word “perform” sometimes throws people off when it comes to categorizing the other two.   Perform Quality Assurance is actually in the executing process group, and Perform Quality Control is in the monitoring & controlling process group.   The reason is that quality assurance focuses on the work being done; it is being done according to the processes set forth in the Quality Management Plan?   Quality control focuses on the actual deliverables that are a product of that work, to see if they meet the level of quality in the Quality Management Plan.

I have a cookbook which provides me with a source of new recipes if I get bored with making the same old thing.   Many times the recipes work out great, but sometimes … they don’t.    I tried to make chocolate brownies from a low-fat recipe and I couldn’t figure why they came out more gooey than chewy, to put it bluntly.

At this point, I had to analyze, was it a problem with a) the ingredients, b) the recipe, or c) the equipment?    Analyzing whether I followed the steps of the recipe was an example of quality assurance.   Did I omit any steps that the recipe called for?   I couldn’t find any–at first.

Then I went to the ingredients, and tried to see if I skipped any, or added the wrong amount of any of them.   This would be more along the lines of quality control.   Nope, that wasn’t it.    The brownies tasted just fine, but the texture was off.  The final product didn’t seem like it got enough heat, and so was underdone somehow.   That’s when I figured it out–the pan was supposed to be on the middle rack, and I put it on the top rack, so it wasn’t getting the heat it required.

I did a design of experiments, and decided to make another batch with the rack in the middle, like the recipe book actually called for.   Success!   So it was not a problem with the ingredients or the equipment, but the processes I followed, in fact, the very last one of putting it in the oven in the wrong spot.   But this shows you that the focus can be on the processes or the product to find out where a quality problem is.   If you do the processes wrong, or the raw materials do not fit the specifications, or there is a problem with the equipment–any of these things can cause the product to not exhibit the quality that was specified in the quality management plan.   Although they are separate project management processes, they can be done in tandem, although in a company it is usually a quality audit team that sees if the processes are being followed in order to fulfill 8.2 Perform Quality Assurance, whereas the quality control team sees if the product is coming out as it should if the processes are being followed faithfully, in order to fulfill 8.3 Perform Quality Control.

I hope this analogy gives you a feel for the difference between the two–they have the same overall purpose, to ensure good quality in the product, but they have different focuses and that is why they are considered two separate processes.

Having made this distinction a little clearer (I hope), the next post will discuss the inputs and outputs, as well as the tools & techniques of 8.2 Perform Quality Assurance.

5th Edition PMBOK® Guide—Chapter 8: Outputs of Plan Quality Management


1.  Introduction

The purpose of this post is to discuss the outputs to the process 8.1 Plan Quality Management.  This outputs are inputs to the other two quality processes as well as other project management processes from other knowledge areas.

8.1 PLAN QUALITY MANAGEMENT
OUTPUTS
1. Quality management plan Describes how the organization’s quality policies will be implemented, and how the project management team plans to meet the quality requirements.
2. Process improvement plan Details the steps for analyzing project management and product development processes to identify activities which add value.
3. Quality metrics Describes an attribute of the project or product and how the quality control process will measure it.  They are used in both the quality assurance and control quality processes.
4. Quality checklists Verifies that a set of required steps has been performed.  They should incorporate the acceptance criteria included in the scope baseline.
5. Project documents updates
  • Stakeholder register
  • Responsibility assignment matrix
  • WBS and WBS dictionary

2.  Outputs of Plan Quality Management

a.  Quality Management Plan

The main output of the process 8.1 Plan Quality Management is the Quality Management Plan.  This outlines the quality policies that will be implemented, so that they can be audited in the next process 8.2 Perform Quality Assurance, and the quality requirements that the management team plans to meet, which is demonstrated during the monitoring and controlling activities that take place in the process 8.3 Control Quality.

b.  Process Improvement Plan

The definition of a project has been changed in the 5th Edition of the PMBOK® Guide.  Before it was “a unique product, service, or result”; now it’s “a unique product, service, or result OR an improvement on an existing product, service, or result.”  This expanded definition of what a project is allows for process improvement like Six Sigma to be included as projects as well.

The Process Improvement Plan is one of the four subsidiary plans (the other three are Change Management, Configuration Management, Requirements Management) in the Project Management Plan, which consists of the performance baselines and the knowledge area management plans (like the Quality Management Plan) in addition to the subsidiary plans.

Here are the elements of the Process Improvement Plan

  •       — Process boundaries (the purpose of the process, its inputs and outputs, process owner, and the stakeholders of the process)
  •        –Process configuration (showing how the various processes fit together)
  •       — Process metrics (if there are any control limits to the processes)
  •       — Targets for improved performance

The process configuration and process boundaries are analogous to the WBS and the WBS dictionary, respectively, but for processes rather than activities, in that they show how they fit together and they give details concerning them.  The metrics and the targets for improved performance show what the current performance baseline is for the current state of the processes and the future (“new and improved”) state of those processes.

c.  Quality Metrics

What are the measurable project or product attributes that can be monitored and controlled in order to control the quality?  On-time performance, defect frequency, failure rate, are all examples of such quality metrics.

d.  Quality Checklists

Checklists are used to ensure consistency in tasks, to remove the variability that the human element naturally brings.

e.  Project Document Updates

  •      Stakeholder updates (to include who gets involved in decisions about various processes, or who gets informed    about them)
  •      Responsibility assignment matrix (to include who “owns” the various processes
  •     WBS and WBS dictionary

The first three of these five outputs (Quality Management Plan, Process Improvement Plan, Quality Metrics) will turn into inputs for the next process 8.2 Perform Quality Assurance, which is the subject of the next post.

The Hometown Parade: Getting our Veterans Back


I moved to Homewood, my home town, at the beginning of April in order to assist my father whose health was failing him and who needed my help to set up long-term health care so that he could regain much of the mobility he had lost in the hospital.

Today was Memorial Day and after seeing Dad (who was a veteran of the Korean War era) in the rehabilitation facility, I returned home and walked to downtown Homewood just in time to see the hometown Memorial Day parade. It was very simple: representatives of the various armed forces were escorted by the policemen and first responders whose vehicles were flashing lights but silent out of respect for the fallen servicemen to whom this day was dedicated.

Along the side of the road were the residents of Homewood, including Boy Scout troops selling American flags, proud parents of the children in the various marching bands, and the families of the veterans for whom the parade was being put on. We all waved and applauded as the various veterans groups passed, and I had a tear in my eye when the patriotic songs were being played by the marching bands which followed.

I had a chance to see the young boys and girls who had braved the inclement weather in order to be part of a parade, and then when they passed–it was over, almost as soon as it began! Everybody followed the last part of the parade as they went over to the Veterans Memorial in downtown Homewood.

By then the veterans had gathered, and I heard speeches from the heads of the local veterans group, very brief and to the point. Finally the wreaths were laid, one for each of the major conflicts of the past century: World War I, World War II, the Korean War, the Vietnam War, and the Gulf War. I assumed that this covered both the first and the second Gulf War and the subsequent war in Afghanistan, and I was sobered by the fact that it has lasted longer than any of the other wars, or as the papers like to refer to them these days, “conflicts.”

I was so heartened by the presence of the community coming together to honor the veterans who had passed away, and those who were still among us, although some of them endured wounds which they will carry for the rest of their lives. Each of the missing veterans has left a hole in the lives of the families left behind, and it was important for us all to try to fill that gap as best we could, with memories of their lives.

For if we don’t remember, then we will not have a chance to weave together again the tattered fabric that remained when they left us, or when a part of them was taken away from their own lives. I loved hearing their speeches, and the only thing I felt when I left was gratitude for what they had done for us, and a longing to hear more. As Sebastian Junger wrote in today’s Washington Post:

“Let them speak. They deserve it. In addition to getting our veterans back, we might get our nation back as well.”

What do we remember on Memorial Day?


When all of the pleasant associations of Memorial Day with the vacations, the start of summer, and barbecuing are taken into account, when else do we remember on Memorial Day?

Just like the three ghosts encountered by Ebenezer Scrooge in Charles Dickens’ A Christmas Carol, we are confronted with three specters. Usually the ghosts of Soldiers Past and Soldiers Present are whom we honor in cemeteries and in our parades, but I think we need to pay attention more to the ghosts of Soldiers Future.

When I say we honor the ghosts of Soldiers present, I’m referring to those veterans who have wounds, visible and otherwise, that are in the process of healing.

The greatest war poem in Western Civilization, the Iliad, has as its companion the greatest poem about the adjustment of a veteran (Odysseus) who in his various adventures in The Odyssey) tries to adjust to domestic life again in a post-world world. It takes him almost as many years as the war in which he fought.

The ghosts of Soldier Future I referred to are the kids who make up the audience of both the parades and the not-so-solemn entertainments that take place this weekend. Can we make sure that they do not needlessly die as soldiers in some future conflict because we did not have the courage to find a solution other than a military one?

I do not take the sacrifice of soldiers past and present lightly, and that is the very reason why I will resist sacrificing yet another generation of soldiers unless I understand the reason for that sacrifice, so that I know it is commensurate with the value of those soldiers’ lives.

And that is why I remember the past and recall the present on Memorial Day.

Duolingo


This post discusses the language learning app called Duolingo. I have been using this app faithfully in the past few months in order to learn two new languages, Italian and Portuguese.

I have gotten to the point where I do one lesson, which consists of answering 20 questions, every day for the past two months. In that time, I have seen my knowledge of these two languages increase to the point where I can understand entire sentences with ease.

The key is doing the exercises carefully and on a regular basis. They are very like the exercises you find in Rosetta Stone.

I really hope the makers of this app come and work on foreign languages that do not use the Western alphabet.

5th Edition PMBOK® Guide—Chapter 8: Team Tools for Planning Quality


1.  Introduction

Among the 8 tools & techniques listed for process 8.1 Plan Quality Management, the one that is listed as #7 is actually a group of tools called Additional Quality Planning Tools, which are listed as:

  •  Brainstorming
  • Force field analysis
  • Nominal group techniques
  • Quality management and control tools

The quality management and control tools will be described when I get to process 8.2 Perform Quality Assurance.  The other three, brainstorming, force-field analysis, and nominal group techniques have one thing in common, and that is they are group or team techniques that are meant to involve the entire project team and/or subject matter experts, whereas the quality tools listed as #3 in the list of 8 could be done as a group, but can also be done alone by a single person.  These tools listed above, however, are meant to be done as a group or team.

2.  Brainstorming—the example of Multivoting

Brainstorming can be done with project team members together with subject matter experts as needed.

One common brainstorming technique is multivoting, where a series of ideas are listed and then the group votes on those that considers to be the most important; this is done to find out what the group considers to be the highest priority.

1. Brainstorm Generate a list of items to be considered using a brainstorming technique.  Record the items on a whiteboard, flipchart, or other surface so members can see it.
2. Review & Combine Review each item so group understands it.  If there are any items that are similar, combine them if group agrees.
3. Number Once items have been combined, number them in a list for voting purposes.
4. Decide Vote Method Group decides on voting method.  Typically, each person gets to vote for 1/3 of the total number of items in list.
5. Conduct Vote Each person votes for items he or she considers most important in list.
6. Tally Vote Tally the amount of votes and list items in terms of number of votes cast.
7. Reduce Items Select items based on voting criteria.  Some groups only choose those items voted on by at least half of the participants.  Some groups eliminate the three least-voted items.
Redo steps 5, 6, and 7 with continuously shrinking list of items until only 4 or 5 remain.
8. Announce Results Announce final four or five ideas that remain after multivoting process complete.
9. Discuss Results Discuss final list of items.  Conduct a group discussion to decide which of the final ideas should receive top priority.  Or conduct one last round of votes to see which item is the priority item.

 3.  Nominal Group Technique

This is also a brainstorming technique, but the difference here between this and the multivoting technique is that the generation of ideas is done separately by members, and the results are pooled together.  This can also be done by sending responses remotely to, say, subject matter experts (SMEs) or stakeholders, for example.

Step Explanation
1. Discuss Explain the purpose of the activity, to generate a list of action items by means of group consensus..
2. Write down Each person should write down their ideas separately; collect them.
3. Clarify Put all ideas on whiteboard.
4. Cull List Combine similar items so you have a final list of ideas.
5. Distribute Cards Distribute index cards so that there is one index card for every 5 or so ideas on the final list.
6. Vote Vote for the best ideas, one idea per index cards.
7. Rank Rank how many votes each idea receives, rank in order from most chosen to least chosen.
8. Announce Announce the top-ranked ideas.
9. Discuss Agree upon moving forward on the action items that were top-ranked by the group.

4. Force field analysis

Force field analysis is a tool in analyzing the forces that are for and against a proposed decision or change that management wants to have implemented in the organization.

Force field analysis was developed in the 1940s by an American social psychologist named Kurt Lewin.  But the more I read about the technique, it reminded me of a technique Ben Franklin described in his autobiography whenever it came time to make a tough decision.  He described it as follows:

.. my Way is, to divide half a Sheet of Paper by a Line into two Columns, writing over the one Pro, and over the other Con. Then during three or four Days Consideration I put down under the different Heads short Hints of the different Motives that at different Times occur to me for or against the Measure. When I have thus got them all together in one View, I endeavour to estimate their respective Weights; and where I find two, one on each side, that seem equal, I strike them both out: If I find a Reason pro equal to some two Reasons con, I strike out the three. If I judge some two Reasons con equal to some three Reasons pro, I strike out the five; and thus proceeding I find at length where the Ballance lies; and if after a Day or two of farther Consideration nothing new that is of Importance occurs on either side, I come to a Determination accordingly.

In modern force field analysis, you divide your paper into three areas, a central rectangle for the central decision or change being proposed, a space on the left-hand side for the forces for the change and a space on the right-hand side for the forces against the change.  You don’t balance out the forces like Ben Franklin supposed but you do list them.

Then you estimate the impact of each of the forces on either side, with one common scale being suggested of 1 to 5, with 1 being “not very impactful” to 5 being “very impactful”.  Then you make the height of each arrow correspond to the number on the scale, and then you calculate the total height of the arrows that are on the left-hand side for the forces for the change and you compare it to the total height of the arrows that are on the right-hand side for the forces against the change.

5.  Conclusion

These three examples above show the different possibilities of coming up with ideas and discussing them using the “collective wisdom” of the group.  This requires the project manager who moderates these team tools & techniques to keep the criticism on a constructive level so the creativity of each member is not discouraged.

On a cultural note, in Japan, the younger members are usually asked their opinions first because the Japanese recognize that deferring to senior members is a tendency in their society because of the respect for seniority in an organization.  If they were to allow the senior members to go first, if the younger members had a different opinion, they would be reluctant to express it if it differed from the opinion of the senior members.  So the younger members are allowed to express their opinion first so as to overcome this built-in deference to seniority that exists in the culture, and to tap the creativity of the younger members who may lack the experience of the senior members, but who make up for it in terms of having a fresh perspective.

Next week, I will discuss the outputs for the process 8.1 Plan Quality Management.

5th Edition PMBOK® Guide—Chapter 8: Seven Basic Quality Tools


1.  Introduction

The planning process in the Quality Management Area is process 8.1 Plan Quality Management.  Among the tools & techniques used in planning quality are the Seven basic quality tools (which collectively are listed as the third in the list of tools & techniques by the PMBOK® Guide for this process).  These seven basic quality tools can can also be used to monitor and control quality in process 8.3 Control Quality.

2.  The Seven Quality Tools

Here’s a description of the Seven Quality Tools used in Quality Management.

i.  Cause-and-Effect Diagrams

Also known as Ishikawa or fishbone diagrams.  The problem (or “special variation” in quality speak) is placed at the “head” of the fishbone and the various “bones” that come off of the “spine” of the fishbone some possible source of the problem.

ii.  Flowcharts

These are useful for diagramming the inputs, processing steps, and outputs that make up a process.  They can be used to better understand a process in order to determine which steps add value to the process and which ones do not (and which therefore can be eliminated).  They can also be used for estimating the cost of implementing quality or for estimating the cost of a failure or nonconformance.

iii.  Checksheets

Checksheets help collect useful data about a potential quality problem, including identifying defects.

iv.  Pareto Diagrams

Once the sources of a problem are identified (for example, through the cause-and-effect diagrams mentioned as tool #1), the Pareto Diagram is a bar chart arranged so that the sources that cause the most of a problem’s effects are listed to the left, and so on towards the right until you get a threshold under which you list the rest of the sources as “other”.

v.  Histograms

They are used to answer basic questions about the statistical distribution of quality data, for example:

–are they normally distributed, skewed in any particular direction?

–are they tightly distributed around a central mean, or loosely distributed?

vi.  Control Charts

When a measurement from a process are taken over time, you can see if the process stays within certain predetermined limits, called control limits, and if they remain randomly distributed around these limits (“random variation”) or if there is any sort of drift that takes place as a result of a “special variation”.

The control limits play the same function that the lane markers do on a highway, to help  drivers steer their cars between them.  This helps prevent cars from going off the road, which would be the equivalent of going beyond the “specification limits”.

vii.  Scatter diagrams

This compares two variables compared to see if changes in one variable are correlated with the changes in the other.  However, one of the basic rules of statistics is that “correlation is not causation”.  If  two variables are correlated, it may be because they are both related to a third variable which causes them both.

This was brought home to me in a psychology class, when the teacher showed a curve which showed for a series of rural French villages the number of storks seen in the village and the number of children both in the village that year.  There was a strong correlation between the two, but although I was a college freshmen, I already knew enough biology to know that an increase of storks were probably not the cause of the increased number of children.

Then I remembered a fact from my French class that storks (or cigognes in French) often nested in the chimneys of rural French houses because the shape and size were convenient for the storks to place their nests there.  That’s when I realized why there was no causation, although there was a correlation.  If there were more houses, there were more storks because there were more chimneys to place their nests in.  But if there were more houses, there were also more families, and therefore more children being born to them.  So both the number of storks and the number of children were dependent on the variable of the number of houses, but independent from each other.

3.  Quality and Health—An analogy

You can understand how the different quality tools are used for different purposes by making an analogy to the health of a patient.  A doctor sees a patient on a regular basis and does tests to see how the patient’s health stacks up against the baseline, which the doctor would figure out beforehand based on the patient’s age, sex, medical history, etc.  This is the monitoring that a doctor has to do.

What if a problem is detected, i.e., some of the medical tests show up some abnormalities?  Then the doctor has to control these problems by diagnosing what the cause is.  Once the doctor figures out the cause or causes, he or she can administer a cure.  Of course, then the doctor must go back and demonstrate that the cure has actually worked.

Then the doctor should try to encourage the patient to improve his or her health by eliminating those things which are bad for it and doing more things that improve it.

With this analogy in mind, let’s take a look at the seven quality tools.


  Quality Tool Purpose Medical analogy
1. Ishikawa or fishbone

(cause-and-effect) diagrams

For finding root cause of quality problems Diagnosing cause of health problems
2. Flowcharts For analyzing processes as step towards improving them Improving patient health on ongoing basis (exercise, etc.)
3. Checksheets For collecting data on a quality problem Monitoring patient health
4. Pareto diagrams Identifies sources that are responsible for the most quality problems Diagnosing cause of health problems
5. Histograms Describes the statistical distribution of quality data Analyzing patient health data
6. Control charts Determines whether the process is stable or unstable Monitoring patient health
7. Scatter diagrams Used to indicate correlation between variables Diagnosing cause of health problems

The next post will discuss some of the additional quality tools listed for process 8.1 Plan Quality Management

5th Edition PMBOK Guide–Chapter 8: The Cost of Quality


1.  Introduction

The first tw0 of the tools & techniques listed for process 8.1 Plan Quality Management are a) cost-benefit analysis and b) Cost of  Quality.

These tools answer the question:   is the effort and expense put into quality management worth the benefit that it brings to the company?    In reality, answering the question “is quality management worth it” in the abstract is a kind of meaningless question.   The more meaningful question is “at what level of quality to the benefits outweigh the costs?   Do we need the expense of, say, a six-sigma level of quality if we are not producing a product that requires that level of quality?

The purpose of this post is to go into some detail regarding the cost of quality to see the categories that it encompasses.   Understanding these categories will help a project manager now only calculate the cost of quality, but will help that project manager to explain the results to management, if the necessity for the costs of quality management are ever questioned.

2.  Cost of Quality

The two basic categories to understand are the costs of conformance and the costs of nonconformance.   The costs of conformance are the costs of doing quality management.   What if you don’t do quality management?   Then the product that the project is going to create may contain defects, and these defects create costs to the company which are the costs of nonconformance.

Within each of these two major categories are two sub-categories.   Let’s take the costs of nonconformance first.   What if the defects are caught before the product gets shipped out to the customer?   Then the defective product needs to be either a) reworked or repaired or, if repair is not possible, b) scrapped or thrown out.    These costs are internal failure costs.    But what if the defects are not caught before the product gets shipped out to the customer?   Then this means it is the customer who will discover them.   The customer may call the customer call center and complain.  The customer will, if the product is covered under warranty, ask for the product to be either repaired or replaced.   If the customer uses the product and the customer or a third party is injured due to a failure of the product, then the customer may make a product liability claim.    If the claim is denied or the amount offered by the company is not agreed upon by the customer, the customer may seek legal remedy by filing a product liability lawsuit against the company.

No matter how serious the claim, from a call to the customer call center to a lawsuit, the customer will not be satisfied with the company that makes the product, and there is the additional cost of lost future business from that customer.   All of these costs are external failure costs.

What can be done to reduce these failure costs?   That’s where the cost of conformance or the cost of quality-related activities comes in.   You can try to prevent defects from happening in the first place, which is a practice encouraged by the Project Management Institute.   This can be done by designing the product so that the probability of defects is reduced right from the start.   Let’s say the design is done with the idea of reducing the amount of defects.   Then the manufacturing process must also be paid attention to so that defects do not show up there either.   This is where training of machine operators or others involved in the process comes in.   The equipment must be maintained so that faulty equipment does not contribute to defects.   Finally, human resource practices must allow operators the time to do the job right.    Trying to squeeze more productivity out of a worker has diminishing returns at a certain point when a tired operator is more likely to make mistakes, the kind that can create defects in the product.    All of these costs are prevention costs.

Although you can try to prevent defects, you must also have a system in place that will detect defects that may occur during the manufacturing process through a series of tests and inspections which may require destructive testing.   Destructive testing means that the component that is randomly selected, once tested, cannot be released to the customer and must be scrapped.   Obviously this is an expense which contributes to the cost of quality.   These are referred to as appraisal costs.


So, in summary:

  • Cost of nonconformance = internal failure costs (rework, scrap) + external failure costs (customer complaints, lost business, warranty, product liability)
  • Cost of conformance = prevention costs (training, quality documentation, equipment, time to do it right) + appraisal costs (testing, inspection, destructive testing loss)

Knowing these categories and being to actually calculate out the costs of quality or the costs of conformance vs. the costs of NOT doing quality (i.e., costs of nonconformance) is the key to being able to explain precisely to management and other interested stakeholders the answer to the question “are the costs of quality management worth it to the company?”

The next post covers the third of the tool & techniques listed for process 8.1 Plan Quality Management, namely the Seven Basic Quality Tools.