Passing the #PMP Exam—Memorizing Formulas (part 4)


The last three posts covered the formulas that cover earned value analysis. This last post in the series will cover some of the remaining formulas that are listed in the “cheat sheet” handout given to us by our PMI-OC chapter.

To clear up any possible confusion, “cheat sheet” is just an expression; it refers not to what you can take with you to the exam, because you cannot take ANYTHING with you to the exam, but rather what you need to memorize so that you can jot in down in the first 15 minutes of pre-exam activity known as the “brain dump.”

Here are the remaining formulas and how to memorize them by understanding them.

1. PERT = (O + 4M + P)/6

PERT is a weighted three-point average. Before we discuss the formula, let’s see what a normal three-point average would look like.

A three-point estimate takes the average of three estimates, the optimistic (O or ☺), most likely (M or K), and pessimistic (P or L):

Three-point average = (O + M + P)/3 or (J + K + L)/3. There are three terms in the numerator so there is a 3 in the denominator.

In the weighted average, you have more confidence in your “most likely” figure, 4 times as much confidence, in fact. So you take the M of the three-point average and replace it with 4M, to get

PERT = (O + 4M + P)/6 or (J + 4K + L)/6

Why the number six on the bottom? Because you have an equivalent of six terms in the numerator, one O, 4 M’s, and one P.

2. Standard deviation = (P – O)/6

Okay, if you understood the last formula, then this is in a cinch. The standard deviation is going to tell you how far apart your estimates are. The greater the standard deviation, the greater the distance between your estimates. What’s the difference between the greatest (the pessimistic or P estimate) and the least (the optimistic or O estimate)? That would be P – O or LJ. Just remember the six in the denominator is the same as the one in the other formula for PERT, and you’ve got it!

3. Total Float = LS – ES or LF – EF (Time Knowledge Area)

If you have done a forward-pass and backward-pass analysis to determine the critical path, then you know the following diagram for each activity.

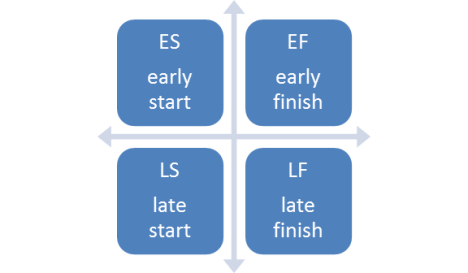
Left to right it goes Start to Finish, like the direction the activities are written in a network diagram. Then the other axis, top and bottom, is the difference between the early (forward-pass) and the late (backward-pass).

Okay, you can start with either LS or LF, and then since you are trying to calculate the float, you just float up one box up above and subtract that quantity, giving you either

Total Float = LS – ES or LF – EF

Just remember that the last letter for the two terms in each of the two formulas is the same, S or F.

4. Communication Channels = n(n-1)/2

Let’s say there are 5 people in a group, and you’re one of them. How many other people than yourself can you talk to? Well, there are 4 others in the group, so you can talk to 4 other people. Since there are 5 people in the group, and each of them can talk to 4 others, then the number of people that can talk to each other is 5 x 4 or 20. But how many communication channels are there? Well, a communication channel is formed by you talking to me, and me talking back to you. So for every two people talking to each other, there is one communication channel (covering back AND forth communication between the two people). So there are actually 20/2 = 10 communication channels.

Generalize this to n people in the group. Each one of the n people can talk to one less than the number in the group or (n-1) people, and for every two people talking to each other, you have one communication channel. So the total of number of communications channels is n(n-1)/2.

Here’s a diagram to make this clearer visually. Okay, let’s say we have a group of six people. They are represented symbolically as the points of this hexagon (hexagon means a six-sided polygon). Each of the 6 points of the hexagon have 5 lines coming out of them. This represents the fact that each of the 6 people can talk to 5 others in the group. But you notice that every line that goes OUT of a point also goes INTO a point of the hexagon as well. If you counted the total number of lines, you would see that you would have to count the 6 x 5 lines coming out of the points, but then you realize that going around the center you end up counting each line twice. So the actual number of communication channels or lines is (6 x 5)/2.

5. PV = FV/(1 + R)t

This is the present value formula designed to figure out what the value TODAY is of FUTURE cash flows. In the formula PV = present value, FV = future value, R is the Rate of interest, and t = time in years.

I think this formula is easier if you do a little algebra, and start out this way

FV = PV * (1 + R)t

Let’s say you have $100 in a CD account, and you gain 5% interest in one year (ah, if only it were true!). Then at the end of year one, you would get a future value of $105. Using the formula,

FV = PV * (1 + R)t = 100 * (1 + 0.05)1 = 100 * (1.05) = $105.

Now the next year your CD earns 5% interest on this new value of $105, and so it would earn at the end of year two the following amount.

FV = PV * (1 + R)t = 100 * (1 + 0.05)2 = 100 * (1.05) (1.05) = $110.25.

Okay, you get the pattern. The FV is the PV increased by the interest rate (1 + R) multiplied times the number of years or t. Once you write down this formula, if you are required to do the backwards calculation and do PV = FV/(1 + R)t, then all you have to do is take the formula for PV and do one simple algebraic step to get the formula you need.

Those are all the formulas we were told would most likely be on the exam. I hope this series of posts was helpful to you.

The next posts are going back to the processes. Once you recognize their NAMES and a GENERAL DESCRIPTION of what they consist of, you now need to go on to memorizing their order, because project management has a certain flow of work to it.

This will be step 4 on the road to Process Mastery!

Advertisement

Passing the #PMP Exam—Memorizing Formulas (part 3)


In the previous post, I covered the formulas that cover those quantities dealing with the forecasting of the project’s cost at the completion of the project. As a review, here is the definition of the relevant terms.

1. Review of BAC, EAC, VAC, ETC

Figure 1. Definitions of BAC, EAC, VAC, and ETC.

Quantity Formula Definition
Budget at Completion (BAC) (Related to PV) Authorized budget amount of the total project, i.e. what the project was supposed to cost
Estimate at Completion (EAC) (several formulas) Estimated cost of the project at completion, i.e., what the project is now expected to cost
Variance at
Completion 
(VAC)
BAC – EAC The difference between what the project was supposed to cost (BAC) and what is now expected to cost (EAC).


Estimate to Complete (ETC) EAC – AC How much more it is estimated it will cost to complete the project, i.e., the difference between what the total project is now expected to cost (EAC) and how much it has cost until now (AC).

Here are the formulas for VAC and ETC, which are simply derived from the simple definition of what they mean.

Figure 2. Formulas for VAC and ETC (via definition)

Variance at Completion (VAC) VAC = BAC – EAC
Estimate to Complete (ETC) ETC = EAC – AC

Here are the various formulas for EAC, which vary depending on the REASON for the variance from the budget at completion or BAC.

Figure 3. Formulas for EAC (based on reason for variance from schedule and/or budget)

Formula

No.

Formula

Formula

Name

Formula Explanation

1

EAC = AC + ETC

New estimate

ETC is new bottom-up estimate

2

EAC = AC + (BAC – EV)

Original estimate

Reason for variance is one-time occurrence

3

EAC = AC + (BAC – EV)/CPI

Or

EAC = BAC/CPI

Performance estimate low

Reason for cost variance will continue at same rate

4

EAC = AC + (BAC – EV)/CPI*SPI

Performance

estimate high

Reason for cost variance will continue and effect schedule performance as well

.

2. To Complete Performance Index–concept

The formulas I will discuss in this post are those for the To Complete Performance Index or TCPI.

First, a mini-review of the formulas so far.

a. PV, EV, and AC tell us about the project NOW. It is like giving a snapshot of where we are.

b. CV, SV, CPI, and SPI tell us whether we are behind/ahead of schedule, and under/over budget NOW. They compare where we are compared to where we are supposed to be.

c. BAC and EAC tell us where we are supposed to be and where we WILL be at the end of the project, respectively. The latter has several formulas that can be used to derive it depending on the reason for our deviance from the place we are supposed to be.

Now, finally the TCPI tells us the following: given where we are now, how will we have to perform with regards to costs in order to be AT BUDGET by the time the project is done?

Think of an analogy. You’re supposed to go from St. Louis to Chicago along a route that has a 65 mph speed limit. You calculate that it will take 5 hours to get there if you drive non-stop at that speed limit. You get halfway there and you realize that, according to records of the time and the mileage actually driven, that you have been going an average of 55 mph speed limit, 10 mph BELOW the speed limit.

How fast will you have to drive the second half of the way in order to get there within the 5 hour projected time? Well, you will have to go 10 mph ABOVE the speed limit for the AVERAGE to equal 65 mph over the entire length of the trip. This is what TCPI tells you for project management.

3. To Complete Performance Index—formula

There are two formulas for the TCPI:

i. Based on the budget at completion (BAC)

TCPI = (BAC – EV)/(BAC – AC)

ii. Based on the estimate at completion (EAC)

TCPI = (BAC – EV)/(EAC – AC)

Rather than memorizing these formulas as collections of random letters, let us understand the quantities in them.

(BAC – EV) is a familiar term from the formulas for EAC, namely the remaining budget. (BAC – AC) is a similar term which represents not the remaining budget, but since it uses AC, it is the remaining cost as per budget. If we substitute EAC for BAC, we get (EAC – AC) or the remaining cost as per estimate.

TCPI in formula i. is thus the remaining budget divided by the remaining cost as per budget.

TCPI in formula ii. is thus the remaining budget divided by the remaining cost as per estimate.

Here is a diagram showing the different quantities we have covered in all of the formulas to show how they relate to each other. Those in BLUE are budgeted values, , those in GREEN deal with the actual costs, and those in YELLOW are estimated values.

Project START

NOW

END

Budget ß

PV

à

ß BAC

à

ß EV à
ß

BAC – EV

à

(remaining budget)
Actual ß

AC

à

ß BAC–AC à
(remaining costs as per budget)
ß

EAC–AC

à

(remaining costs as per estimate)
Estimate
ß EAC

à

ß

ETC

à

ßVACà

4. TCPI—example

Okay, let’s use a scenario from a previous post and calculate TCPI to see what it’s significance is in this example.

Scenario 1: Let’s say you are a contractor that gets the job of painting the outside of the Pentagon. Your company can finish each side in a single day at a cost of $10,000 per day. The total budget for the project is 5 X $10,000 = $50,000. (Assume that you are painting one side at a time, waiting for one side to dry before going on to the next.)

At the end of day 4, only three walls are completed. The amount spent by your company to accomplish the work so far comes to $30,000. Assume that the reason for being overbudget and behind schedule will continue until the end of the project.

a. What are PV, EV, and AC?

PV = $40,000, EV = $30,000, and AC = $40,000.

b. What are CV, SV, CPI, and SPI?

CV = EV – AC = $30,000 – $40,000 = -$10,000

SV = EV – PV = $30,000 – $40,000 = -$10,000

CPI = EV/AC = $30,000/$40,000 = 0.75

SPI = EV/PV = $30,000/$40,000 = 0.75

c. What is BAC?

BAC = $50,000, the total budgeted amount of the project at completion.

d. What is EAC?

First of all, you need to figure out which formula to use for EAC. We are told in the scenario that the COST and SCHEDULE variance will continue to the end of the project, so formula 4 is the most appropriate. Here’s the calculation, using the values derived in a, b, and c above.

EAC = AC + (BAC – EV)/(CPI * SPI) = $40,000 + ($50,000 – $30,000)/(0.75)(0.75)

= $40,000 + ($20,000)/(0.75)(0.75) = $40,000 + $35,556 = $75,556.

e. What is TCPI? (based on BAC)

According to formula i.

TCPI = (BAC – EV)/(BAC – AC) = ($50,000 – $30,000)/($50,000 – $40,000) = $20,000/$10,000 = 2.0

This means that, based on the BAC or budget at completion, we would have to go from a cost performance index of 0.75 which is where we are now, and increase it to 2.0 from now until the rest of the project in order to get to the end of the project WITHIN THE BUDGET.

This makes sense in that we would have to have good cost performance from now until the end of the project in order to make up for the poor cost performance up until now.

This concludes the discussion of these formulas. They are not in the “cheat sheet” handed out by the PMI-OC chapter for its PMP exam prep class because they are considered too elaborate to be on the test. I include them for completeness sake so you can understand where they come from.

The next and last post deals with some other random formulas from various areas of knowledge other than cost (i.e., not earned value analysis).

Passing the #PMP Exam—Memorizing Formulas (part 2–Earned Value)


In the previous post, I covered the basic formulas having to do with the three quantities of Planned Value (PV), Earned Value (EV), and Actual Cost (AC).

1. Review of PV, EV, AC

Just for review, here is the definition of the quantities themselves.

Quantity Measures Also known as Definition
Planned Value (PV) Schedule Budgeted Cost of Work Scheduled Authorized budget amount assigned to the work scheduled to be accomplished
Earned Value
(EV)
Schedule AND Budget Budgeted Cost of Work Performed Authorized budget amount assigned to the work actually accomplished
Actual Cost
(AC)
Budget Actual Cost of Work Performed Actual costs incurred to complete workactually accomplished

And here are the simple formulas related to these quantities:

Derived Quantity

Formula

Cost Variance (CV) EV – AC
Schedule Variance (SV) EV – PV
Cost Performance Index (CPI) EV / AC
Schedule Performance Index (SPI) EV / PV

These formulas tell you the answer to the question “where are we in relationship to the schedule and budget?” Another question you might get is, “will be finish the project on time and within the budget?” To calculate these quantities, we need to introduce some new terms.

2. Terms dealing with the project cost at completion

Quantity Formula Definition
Budget at Completion (BAC) (Related to PV) Authorized budget amount of the total project, i.e. what the project was supposed to cost
Estimate at Completion (EAC) (several formulas) Estimated cost of the project at completion, i.e., what the project is now expected to cost
Variance at
Completion
(VAC)
BAC – EAC The difference between what the project was supposed to cost (BAC) and what is now expected to cost (EAC).
Estimate to Complete (EAC) EAC – AC How much more it is estimated it will cost to complete the project, i.e., the difference between what the total project is now expected to cost (EAC) and how much it has cost until now (AC).

3. Relationship between PV, AC and the terms of completion (BAC, EAC, ETC, VAC)

Perhaps a diagram would best explain the relationship of these terms.

Project START

NOW

END

Budget ß

PV

à

ß BAC

à

Actual ß

AC

à

Estimate
ß EAC

à

ß

ETC

à

ßVACà

The project starts, the project keeps going until the point where we are doing the earned value analysis, which is listed as NOW and is represented by the solid line down the center. The end of the project is listed above.

Those terms that deal with the point right NOW are the planned value or PV, which is the budgeted value of the work was supposed to done up to now, and the actual cost or AC, which is the actual cost of the work that was actually done up to now. The

If the project were to go as planned, the project would be completed at the amount it was budgeted for, which is the BAC, or Budget at Completion. It is the analogous value for PV if it were measured not NOW at the present moment but at the end or completion of the project. That is why it is in blue like PV to make sure you understand that they are both based on the budget.

AC is in green to let you know that it is based not on the budget, but on the actual costs.

What about the estimate at completion? It is the amount that it is estimated the project will cost at completion. But EAC is made up of AC, which is the actual cost up to now, and the estimated cost to complete, which is ETC. The difference between the BAC, the budgeted amount, and the ETC, the estimated amount at completion, is the VAC or variance at completion.

So two of the formulas that relate to the terms of completion, namely,

Variance at Completion (VAC) VAC = BAC – EAC
Estimate to Complete (ETC) ETC = EAC – AC

can be memorized simply by visualizing the diagram and realizing what the terms mean.

4. Calculating the EAC

So how to you calculate the EAC? As listed in the chart in paragraph 2, there are several formulas, which is always a point of confusion for test takers. How do you know which one to use? Here are the formulas, their characteristics, and an explanation of when they are to be used.

The purpose of each formula for EAC is to estimate how much it will take to complete the project based on the performance to date. If the project is over budget or behind schedule, the key in figuring out the EAC is to analyze WHY it is over budget or behind schedule. This will give you the clue as to which formula to use. I’ll give some examples after explaining the terms in the table.

Formula

No.

Formula

Formula

Name

Formula Explanation

1

EAC = AC + ETC

New estimate

ETC is new bottom-up estimate

2

EAC = AC + (BAC – EV)

Original estimate

Reason for variance is one-time occurrence

3

EAC = AC + (BAC – EV)/CPI

Or

EAC = BAC/CPI

Performance estimate low

Reason for cost variance will continue at same rate

4

EAC = AC + (BAC – EV)/CPI*SPI

Performance estimate high

Reason for cost variance will continue and effect schedule performance as well

Formula 1. If the original budget is considered totally flawed, then one way to estimate the amount it will now take to do the project is to take the amount spent on the project so far (AC) and then do a more accurate bottom-up estimate of the amount it will take to complete the project (ETC). That’s one way to do it. But if you are answering a question from the PMP exam, don’t use this formula unless it specifically states the ETC is a brand-new estimate. In this case, they will have to give you the figure for ETC because it is not derivable from any other formula but from the project’s own WBS (work-breakdown structure).

Formulas 2-4. The rest of the formulas are similar in that they all start with AC, the actual cost up to now, and then they add an amount called the remaining budget or BAC – EV, modified by some other factor.

What is the remaining budget? Take a look at the chart below which adds EV and the BAC – EV or remaining budget figure.

Project START

NOW

END

Budget ß

PV

à

ß BAC

à

ß EV à
ß

BAC – EV

à

Actual ß

AC

à

Estimate
ß EAC

à

ß

ETC

à

ßVACà

In this chart, the assumption is made that the EV is somehow different than the PV, i.e., the project is off schedule somehow. Now the PV is essentially useless for planning purposes because it shows you the value of the work that was supposed to be done, and the assumption is that the EV is somehow different than that. So the logical think to do is to start figuring out how much work actually needs to be completed from now (EV) to the end of the project (EAC), and that difference EAC – EV is the remaining work.

Let’s go back to our Pentagon example from the previous post.

Scenario 1: At the end of day 4, only three walls are completed. The amount spent by your company to accomplish the work so far comes to $40,000.

Here the PV = $40,000, and the EV = $30,000. Remember that the total amount budgeted for the project (BAC) = $50,000.

Now what is the remaining budget? Well, there are two walls left to be painted, and that will cost $20,000. So the remaining budget to complete the work is $20,000. You can see how this works with the formula because

Remaining budget = BAC – EV = $50,000 – $30,000 = $20,000

Now let’s take a look at the formulas in more detail using variations of the scenario 1 based on the REASON for the delay.

Formula 2.

Scenario 2: At the end of day 4, only three walls are completed. The amount spent by your company to accomplish the work so far comes to $30,000.

If the reason for the delay in painting the walls is a one-time occurrence, let’s say because it rained that one day and we don’t expect (according to the weather forecast) that it will happen again, that the EAC is simply

EAC = AC + (BAC – EV) = $30,000 + ($50,000 – $30,000) = $30,000 + $20,000 = $50,000.

This makes sense because the work done so far (3 walls) should have cost $30,000, and that’s what is actually cost. So if the rain was a one-time occurrence, and the painters continue at their same pace, it will take 2 days to complete, at a cost of $20,000 (2 x $10,000), so the total estimated cost = $50,000. The project will be one-day late in completion, but not under budget.

Scenario 3. At the end of day 3, three walls are completed. The amount spent by your company to accomplish the work so far comes to $40,000.

In this scenario, the workers are doing the project on time, but their cost is higher than expected. You would expect 3 walls to cost $30,000, not $40,000. So in this case PV = $30,000, EV = $30,000, and the SV = PV – EV = $30,000 – $30,000 = 0, meaning that the project is right on schedule.

But with regards to the cost, AC = $40,000, so CPI = EV/AC = $30,000/$40,000 = 0.75. This means that the project is over budget (by $10,000).

What is the estimate at completion? Assuming that the workers continue to work at the same rate of pay, then the remaining two days should be billed at the same rate as the ones up until now, meaning that the CPI or cost performance index should be the same up until the end of the project. This fits into the “variance continues at the same rate” scenario that fits formula 3.

If you remember the earlier formula 2, EAC = AC + (BAC – EV), and just divide the remaining budget term by CPI, you get

EAC = AC + (BAC – EV)/CPI

Now here’s a shortcut: if you do all the algebra, the above equation simplifies to

EAC = BAC/CPI

Here’s how to remember the shortcut: take the original equation and literally cut in short, i.e., cut out all the terms that are shorter (have 2 letters rather than 3) and you get, as if by magic, the formula above.

In this case,

EAC = BAC/CPI = $50,000/0.75 = $66,667.

Scenario 4. At the end of day 4, three walls are completed. The amount spent by your company to accomplish the work so far comes to $40,000.

So the three walls worth of work are costing $40,000, more than $30,000 than expected. That’s one factor that will continue supposedly at the same rate throughout the project, similar to Scenario 2. But now, you have the added factor that they are doing the work more SLOWLY than anticipated, because they are doing three walls worth of work in the time they were expected to do four. This means that not only the cost, but the schedule is now compromised. Let’s just say it has to do with the type of brushes they are using not being as effective as had originally been thought (they are using hand brushes, let’s say, rather than roller brushes). Now the COST AND SCHEDULE factors will cause a delay, and here we have to use the more complicated formula of

EAC = AC + (BAC – EV)/(CPI * SPI)

I tried the algebra on this equation and it doesn’t simply into anything nice and neat like formula 3. So there’s no alternative but to slog it out.

Here BAC = $50,000, PV = $40,000, EV = $30,000, and AC = $40,000, so

CPI = EV/AC = $30,000/$40,000 = 0.75, SPI = EV/PV = $30,000/$40,000 = 0.75, so

EAC = AC + (BAC – EV)/(CPI * SPI) = $40,000 + ($50,000 – $30,000)/(0.75)(0.75)

= $40,000 + ($20,000)/(0.75)(0.75) = $40,000 + $35,556 = $75,556.

So, if you remember the REASON for the delay in the project, you can figure out whether you are to use formula 2, 3, or 4. No further delay, it’s formula 2. A continued reason for being overbudget, then it’s formula 3. If it’s a continued reason for being overbudget AND behind schedule, then it’s formula 4.

Formula 3 has the advantage of being able to be simplified somewhat.

Tomorrow, there are just two more Earned Value formulas to mention, but they are so complicated that our instructors in our PMP exam prep course didn’t even include them in our list of formulas to memorize because they thought the chance was remote of it being included on the exam. I will list it for the sake of completion, because the concept behind the formula is actually quite important.

Passing the #PMP Exam—Memorizing Formulas (part 1–Earned Value)


The majority of the formulas that have to be memorized come from the Cost Management knowledge area, in particular from Earned Value Management. Rather than simply memorizing formulas in terms of random arrangements of letters in an equation, our study group found it better to understand the underlying reasoning behind the formulas. This will help one recreate any particular formulas if one happens to forget it.

The first part of this series of blog posts will be on the three fundamental quantities or values that tell you where you are at any given moment of the project with respect to a) the schedule, b) the budget, or c) both.

These quantities are the Planned Value (PV), Earned Value (EV), and Actual Costs (AC).

Quantity Measures Also known as Definition
Planned Value (PV) Schedule Budgeted Cost of Work Scheduled Authorized budget amount assigned to the work scheduled to be accomplished
Earned Value (EV) Schedule AND Budget Budgeted Cost of Work Performed Authorized budget amount assigned to the work actually accomplished
Actual Cost (AC) Budget Actual Cost of Work Performed Actual costs incurred to complete workactually accomplished

Let’s take an example to make this clearer. Let’s say you are a contractor that gets the job of painting the outside of the Pentagon. Your company can finish each side in a single day at a cost of $10,000 per day. The total budget for the project is 5 X $10,000 = $50,000. (Assume that you are painting one side at a time, waiting for one side to dry before going on to the next.)

The purpose of these three quantities is to tell you how you are doing with respect to this plan which includes a budget of $50,000 and a schedule of 5 days. Let’s pick a scenario where the project is partially finished.

Scenario 1: At the end of day 4, only three walls are completed. The amount spent by your company to accomplish the work so far comes to $40,000.

It’s obvious that you are behind schedule, because you are supposed to have four walls done by the end of day 4. Also, if you’ve spent four days worth of the budget, but only have completed three days worth of the work, you have overspent your budget somehow.

What are the three quantities above in this scenario?

1) PV = $40,000. The work scheduled to be accomplished by the end of day 4 is four walls, and the amount authorized in the budget to complete that amount of work is 4 x $10,000 = $40,000. This is the planned value or the value of the work that is scheduled to be done by this time in the project.

2) EV = $30,000. The work actually accomplished by the end of day 4 is only 3 walls, and the amount authorized in the budget to complete that amount of work is 3 x $10,000 = $30,000. This is the earned value or the budgeted value of the work that is actually done by this time in the project.

3) AC = $40,000. This number comes from the fact given in the scenario. This is the actual cost of the work that is actually done by this time in the project.

“Planned value” tells you where you are supposed to be in the budget if you are on schedule. “Actual costs” tells you exactly what the costs were based on the work that was actually performed, as the name would tell you. “Earned value” is the lynchpin which links these concepts together, because it gives you information on the plan or budget (what the work was supposed to cost), but it also gives you information on the actual work done. So all of the formulas start with EV and either relate it to PV or AC. These four formulas derived from these three basic quantities tell you whether you are a) ahead or behind schedule, or b) under or over budget, respectively. The Schedule Variance (SV) or Schedule Performance Index (SPI) tell you whether you are ahead or behind schedule, and the Cost Variance (CV) or Cost Performance Index (CPI) tell you whether you are under or over budget.

Here are the steps to memorize the formula.

Step 1: All formulas start with EV.

Derived Quantity

Formula

Cost Variance (CV) EV
Schedule Variance (SV) EV
Cost Performance Index (CPI) EV
Schedule Performance Index (SPI) EV

Step 2: If the formula has the word “Variance” in it, the EV is followed by a – (subtraction) sign.

If the formula has the word “Index” in it, the EV is followed by a / (division) sign.

Derived Quantity

Formula

Cost Variance (CV) EV –
Schedule Variance (SV) EV –
Cost Performance Index (CPI) EV /
Schedule Performance Index (SPI) EV /

This should be clear because a “variance” means that one thing is greater than the other, and the way to tell the difference is by subtracting one from the other. An index, such as a refractive index or other such physical quantity is measured by a ratio, and so involves division.

Step 3: If the formula has the word “Cost” in it, then insert “AC” because it has the word “Cost” as well.

If the formula has the word “Schedule” in it, then insert “PV” because it has the word “planned” in it which means according to schedule.

Derived Quantity

Formula

Cost Variance (CV) EV – AC
Schedule Variance (SV) EV – PV
Cost Performance Index (CPI) EV / AC
Schedule Performance Index (SPI) EV / PV

And that is it! Those are the four basic formulas you have to memorize for telling you “where you are” in the project.

Let’s bring back our scenario about the Pentagon and see what kind of numbers our example yields. Just to repeat:

Scenario 1: At the end of day 4, only three walls are completed. The amount spent by your company to accomplish the work so far comes to $40,000.

We know from our earlier discussion that in this case: PV = $40,000, EV = $30,000, and AC = $40,000. We already surmised based on the logic of the scenario that we are a) behind schedule and b) over budget. What do the four formulas tell us?

Derived Quantity

Formula

Value (in $)

Cost Variance (CV) EV – AC 30,000 – 40,000 = -10,000
Schedule Variance (SV) EV – PV 30,000 – 40,000 = -10,000
Cost Performance Index (CPI) EV / AC 30,000 / 40,000 = 0.75
Schedule Performance Index (SPI) EV / PV 30,000 / 40,000 = 0.75

It gives a negative number in case of the two variances. This means that a negative number for CV or SV is bad, meaning either the cost is over budget or the project is behind schedule, respectively. A positive number would have meant the reverse, either that the cost was under budget or the project was ahead of schedule.

With the indexes, a number less than one for CPI or SPI means either the cost is over budget or the project is behind schedule, respectively. A number greater than one would have meant the reverse, either that the cost was under budget or the project was ahead of schedule.

In the next post, we discuss the next step in earned value analysis. Once you know where you are in relationship to the project plan, if your boss asks you “how long will it take to finish the project, and how much will it cost us?”, there are quantities you need to know that tell you this. The formula for these quantities will be discussed next time.

Passing the #PMP Exam—Study Group Discussions (The Process Matrix— Procurement Management Knowledge Area)


In the last post, I went through the 6 processes in the Risk knowledge area (chapter 11 of the PMBOK® Guide).

 In this post, I go through the 4 processes in the Procurement Management knowledge area (chapter 12 of the PMBOK® Guide).

Here’s where we are so far: the boxes in green are what has already been covered, and the boxes in yellow are being covered in this post.

Initiating Planning Executing Monitoring & Controlling Closing
Integration 6

1

1

1

2

1

Scope 5

3

2

Time 6

5

1

Cost 3

2

1

Quality 3

1

1

1

Human Resources 4

1

3

Communications 5

1

1

2

1

Risk 6

5

1

Procurements 4

1

1

1

1

2

20

8

10

2

Here’s the portion of the process matrix that lists the processes in the Risk Management knowledge area, which is chapter 11 of the PMBOK® Guide.

Knowledge area # Initiating Planning Executing Monitoring & Controlling Closing
Procurement 4

1

1

1

1

Here’s a description of the six processes that are included in the Risk Management Knowledge Area, 5 of which are in the Planning Process Group, and the remaining 1 of which is in the Monitoring & Controlling Process Group.

Process

Group

Process

Number

Process
Name
Process Description
Planning 12.1 Plan Procurements Project purchasing decisions, identifying potential sellers.
Executing 12.2 Conduct Procurements Selecting a seller through bids or proposals, awarding a contract.
Monitoring & Controlling 12.3 Administer Procurements Managing procurement relationships, monitoring contract performance, making changes as needed.
Closing 12.4 Close Procurements Verification that deliverables are acceptable, formal closure of contract.

12.1 Plan Procurements

This is where the company decides for components, software or whatever intermediate steps are needed to produce the deliverables, whether the company will make them in-house or whether it will be more cost-effective to have them made by a subcontractor or seller.

If the decision is to make them in-house, then the rest of the procurement processes 12.2-12.4 are cancelled because there are no procurements. However, if the decision is to have some of them made by sellers, then the potential sellers are identified.

12.2 Conduct Procurements

Here is where the contract is awarded through a bidding or proposal process to the seller that meets the criteria set out in 12.1 Plan Procurements.

12.3 Administer Procurements

Once the seller has been selected in 12.2 Conduct Procurements, the terms of the contract are fulfilled by the seller and the project manager watches over the relationship with the seller, the performance of the seller with respect to the terms of the contract, and if there are any conflicts, these are resolved.

12.4 Close Procurements

This is closely tied to the only other process that is in the Closing Process Group, namely, 4.6 Close Project or Phase under the Integration Management knowledge area. The work that the seller has done and the deliverables that the seller produces to help complete the project are verified as acceptable. This is where the company signs off on the completion of the contract, and brings it to formal closure.

This concludes the survey of the 42 project management processes giving their names and brief descriptions by knowledge area.

The next step in the memorization of the processes is to memorize their ORDER, which is the subject of the next step 4 in Process Mastery, namely, Gaming the System, which refers to playing various games to get one familiar with the order of the processes, this time not by knowledge area (horizontally in the matrix), but by process group (vertically in the matrix).

However, before going on to Step 4, I want to include a few tips on the brain dump for the formulas, because these, together with the 42 processes, constitute the bulk of the material you need to reproduce in the first 15 minutes of the examination time you are allotted.

Passing the #PMP Exam—Study Group Discussions (The Process Matrix— Risk Management Knowledge Area)


In the last post, I went through the 5 processes in the Communications knowledge area (chapter 10 of the PMBOK® Guide).

In this post, I go through the 6 processes in the Risk Management knowledge area (chapter 11 of the PMBOK® Guide).

Here’s where we are so far: the boxes in green are what has already been covered, and the boxes in yellow are being covered in this post. (Boxes in grey are to be covered in future posts.)

Initiating Planning Executing Monitoring & Controlling Closing
Integration 6

1

1

1

2

1

Scope 5

3

2

Time 6

5

1

Cost 3

2

1

Quality 3

1

1

1

Human Resources 4

1

3

Communications 5

1

1

2

1

Risk 6

5

1

Procurements 4

1

1

1

1

2

20

8

10

2

Here’s the portion of the process matrix that lists the processes in the Risk Management knowledge area, which is chapter 11 of the PMBOK® Guide.

Knowledge area # Initiating Planning Executing Monitoring & Controlling Closing
Risk Management 6

5

1

Here’s a description of the six processes that are included in the Risk Management Knowledge Area, 5 of which are in the Planning Process Group, and the remaining 1 of which is in the Monitoring & Controlling Process Group.

Process

Group

Process

Number

Process
Name
Process Description
Planning 11.1 Plan Risk Management Defining how to conduct risk management activities for a project.
11.2 Identify Risks Determining which risks may affect the project objectives and documenting their characteristics.
11.3 Perform Qualitative

Risk Analysis

Prioritizing risks for further analysis by assessing likelihood & impact.
11.4 Perform Quantitative Risk Analysis Numerically analyzing the effect of risks on project objectives.
11.5 Plan Risk Responses Developing options and actions to enhance opportunities and reduce risk.
Monitoring & Controlling 11.6 Monitor & Control

Risks

Tracking identified risks, implementing risk response plans if risks occur, and evaluating risk process effectiveness.

11.1 Plan Risk Management

This process answers the question “how will we manage risk?” Risk categories are identified in preparation for when risks are identified in process 11.2, definitions of risk probability and impact are laid down in preparation for processes 11.3-11.5, and finally the way risks are tracked and reported on are hammered out in preparation for process 11.6.

11.2. Identify Risks

Risks are identified by the various groups of stakeholders using various information-gathering techniques and are organized and put in a risk register.

11.3 Perform Qualitative Risk Analysis

The risks are rated according to two variables, their probability and their impact. This gives a general idea of their severity.

11.4 Perform Quantitative Risk Analysis

This process focuses on quantifying the impact of a particular risk on a project. The aggregate of all risks is evaluated.

11.5 Plan Risk Responses

The risks identified in 11.2, qualified in 11.3 and quantified in 11.4 are now planned for both in terms of resources and/or activities needed to reduce their impact on the project objectives.

All of the above are done during the planning process. The following process is done during the Monitoring & Controlling Process, which should be obvious given the title of the process.

11.6 Monitor & Control Risks

This is where risks that were identified are tracked during the course of the project, and corrective action taken according to 11.5 Plan Risk Responses if they do occur. The project management plan is updated to reflect any changes that occur to the project schedule, costs, etc., as a result of risks that do occur.

The next post will cover the final chapter of the PMBOK® Guide, chapter 12 covering Project Procurement Management.

Passing the #PMP Exam—Study Group Discussions (The Process Matrix— Communications Knowledge Area)


In the last post, I went through the 4 processes in the Human Resources knowledge area (chapter 9 of the PMBOK® Guide).

In this post, I go through the 4 processes in the Communications knowledge area (chapter 10 of the PMBOK® Guide).

NOTE:   Due to an editing error, the diagram below says HUMAN RESOURCES when it should say COMMUNICATIONS under “Step 3 The Matrix”.

Here’s where we are so far: the boxes in green are what has already been covered, and the boxes in yellow are being covered in this post. (Boxes in grey are to be covered in future posts.)

Initiating Planning Executing Monitoring & Controlling Closing
Integration 6

1

1

1

2

1

Scope 5

3

2

Time 6

5

1

Cost 3

2

1

Quality 3

1

1

1

Human Resources 4

1

3

Communications 5

1

1

2

1

Risk 6

5

1

Procurements 4

1

1

1

1

2

20

8

10

2

Here’s the portion of the process matrix that lists the processes in the Quality knowledge area, which is chapter 8 of the PMBOK® Guide.

Knowledge area # Initiating Planning Executing Monitoring & Controlling Closing
Communications 5

1

1

2

1

Here’s a description of the five processes that are included in the Communications Knowledge Area, 1 of which is in the Initiating Planning Process Group, 1 of which is in the Planning Process Group, 2 of which are in the Executing Process Group, and the remaining 1of which is in the Monitoring & Controlling Process Group.

Process
Group
Process
Number
Process
Name
Process Description
Initiating 10.1 Identify Stakeholders Identifying project stakeholders, that is, people impacted by the project, and documenting their interests, involvement, and impact on the project.
Planning 10.2 Plan Communications Determining the needs of project stakeholders for information and defining a communication approach.
Executing 10.3 Distribute Information Making relevant information available to project stakeholders.
10.4 Manage Stakeholder Expectations Communicating with project stakeholders to meet their needs and address issues as they occur.
Monitoring & Controlling 10.5 Report Performance Collecting and distributing performance information (status reports, progress measurements, forecasts) to project stakeholders.

10.1 Identify Stakeholders

Note that this is the only other knowledge area other than Integration which has a process under the Initiating Process Group. Identifying stakeholders is vital because these contain people who will give formal approval for the project to start, and who will acknowledge the formal closing of the project. Documenting their interests and influence in the project is important because that will help in prioritizing communications.

10.2 Plan Communications

Using the list of stakeholders and the analysis of their interests in the project, you can now plan on answering the 5 questions of information:

  • who gets told,
  • what information is given them,
  • at what frequency (when)
  • in what form, and
  • by whom

For example, routine status reports may go to a group of stakeholders, whereas critical issues may only go to a subset of them. Once you have planned all of the communication, you can then go on to do the project.

10.3 Distribute Information

And in executing the project, you will now send the information to stakeholders as planned in process 10.2 Plan Communications.

10.4 Manage Stakeholder Expectations

When the stakeholders receive the information, they may react with questions, objections, etc., and their response is managed in this process.

10.5 Report Performance

On a regular basis, when you get word of how the project is coming along, you will want to, from time to time, inform stakeholders according to the plan set forth in process 10.2 Plan Communications.

These processes are relatively clear from the title, except perhaps Manage Stakeholder Expectations, because in reality, you are expected to do something somewhat wider in scope than that, in particular, to address issues or problems that may be expressed by the stakeholders.

The next post will be on Chapter 11, Project Risk Management.

Passing the #PMP Exam—Study Group Discussions (The Process Matrix— Human Resources Knowledge Area)


In the last post, I went through the 3 processes in the Quality knowledge area (chapter 8 of the PMBOK® Guide).

In this post, I go through the 4 processes in the Human Resources knowledge area (chapter 9 of the PMBOK® Guide).

Here’s where we are so far: the boxes in green are what has already been covered, and the boxes in yellow are being covered in this post. (Boxes in grey are to be covered in future posts.)

Initiating Planning Executing Monitoring & Controlling Closing
Integration 6

1

1

1

2

1

Scope 5

3

2

Time 6

5

1

Cost 3

2

1

Quality 3

1

1

1

Human Resources 4

1

3

Communications 5

1

1

2

1

Risk 6

5

1

Procurements 4

1

1

1

1

2

20

8

10

2

Here’s the portion of the process matrix that lists the processes in the Quality knowledge area, which is chapter 8 of the PMBOK® Guide.

Knowledge area # Initiating Planning Executing Monitoring & Controlling Closing
HR 4

1

3

Here’s a description of the four processes that are included in the Human Resources Knowledge Area, 1 of which is in the Planning Process Group, and the remaining 3 of which are in the Executing Process Group.

Process

Group

Process

Number

Process
Name
Process Description
Planning 9.1 Develop Human Resources Plan
Identifying project roles and responsibilities, create staffing management plan.
Executing 9.2 Acquire Project Team Confirming human resource availability and obtaining team.
9.3 Develop Project Team Improving team interaction and team environment.
9.4 Manage Project Team Optimizing team performance by tracking member performance, resolving conflicts, providing feedback.

9.1 Develop Human Resources Plan

The roles and responsibilities must be agreed upon beforehand, because if there is a problem, people need to know who to turn to for expert advice or for decisions to be made. The staffing plan allows the project manager to know who is available for how much time during the course of the project.

These two questions of “what role will team members play?” and “what team members are available?” are answered in the planning stage.

9.2 Acquire Project Team

The first part of executing a project is obtaining the team members from the human resources department.

9.3 Develop Project Team

Here is the process that takes the “team members” and turns them into a team that works together.

9.4 Manage Project Team

This process is where the “continuous improvement” part of the project, where you try to fine-tune the performance of the members of the team as individuals (by measuring their performance by increasing their skills), to reduce conflict between individual team members (through conflict resolution techniques), and for those conflicts that do arise, to create lessons learned to prevent similar conflicts from happening in the future.

These three processes are fairly easy to understand in connection with their names, so remembering what their basic purpose is should not be too difficult.

The next post will cover the next Knowledge Area, that of Communications management.

Passing the #PMP Exam—Study Group Discussions (The Process Matrix— Quality Knowledge Area)


 In the last post, I went through the 3 processes in the Cost knowledge area (chapter 7 of the PMBOK® Guide).

 In this post, I go through the 3 processes in the Quality knowledge area (chapter 8 of the PMBOK® Guide).

Here’s where we are so far: the boxes in green are what has already been covered, and the boxes in yellow are being covered in this post. (Boxes in grey are to be covered in future posts.)

Initiating Planning Executing Monitoring & Controlling Closing
Integration 6

1

1

1

2

1

Scope 5

3

2

Time 6

5

1

Cost 3

2

1

Quality 3

1

1

1

Human Resources 4

1

3

Communications 5

1

1

2

1

Risk 6

5

1

Procurements 4

1

1

1

1

2

20

8

10

2

Here’s the portion of the process matrix that lists the processes in the Quality knowledge area, which is chapter 8 of the PMBOK® Guide.

Knowledge area # Initiating Planning Executing Monitoring & Controlling Closing
Quality 3

1

1

1

Here’s a description of the three processes that are included in the Cost Knowledge Area, 1 of which is in the Planning Process Group, 1 of which is in the Executing Process Group, and 1 of which is in the Monitoring & Controlling Process Group.

Process

Group

Process

Number

Process
Name
Process Description
Planning 8.1 Plan Quality Identifying quality requirements and/or standards for the project and product; documenting how project will demonstrate compliance.
Executing 8.2 Perform Quality Assurance Auditing quality requirements and results from quality control measurements to ensure appropriate quality standards are used.
Monitoring & Controlling 8.3 Perform Quality Control Monitors and records results of quality activities to assess performance and recommend necessary changes.

8.1 Plan Quality

The question being answered here is: what are the quality standards that will be used on the project?

8.2. Perform Quality Assurance

The question being answered here is: are the quality standards appropriate for the project? The auditing focuses on the quality of the processes themselves.

8.3 Perform Quality Control

The question being answered here is: are the deliverables meeting the quality standards? The monitoring focuses on the quality of the deliverables. If they don’t meet the standards, then this becomes a basis for a recommendation for change. Basset boasts burst of brillianceBasset boasts burst of brilliance

The next post will cover the next Knowledge Area, that of Human Resource management.

Passing the #PMP Exam—Study Group Discussions (The Process Matrix—Cost Knowledge Area)


In the last post, I went through the 6 processes in the Time knowledge area (chapter 6 of the PMBOK® Guide).

In this post, I go through the 3 processes in the Cost knowledge area (chapter 7 of the PMBOK® Guide).

Here’s where we are so far: the boxes in green are what has already been covered, and the boxes in yellow are being covered in this post. (Boxes in grey are to be covered in future posts.)

Initiating Planning Executing Monitoring & Controlling Closing
Integration 6

1

1

1

2

1

Scope 5

3

2

Time 6

5

1

Cost 3

2

1

Quality 3

1

1

1

Human Resources 4

1

3

Communications 5

1

1

2

1

Risk 6

5

1

Procurements 4

1

1

1

1

2

20

8

10

2

Here’s the portion of the process matrix that lists the processes in the Cost knowledge area, which is chapter 7 of the PMBOK® Guide.

Knowledge area # Initiating Planning Executing Monitoring & Controlling Closing
Cost 3

2

1

Here’s a description of the three processes that are included in the Cost Knowledge Area, 2 of which are in the Planning Process Group and 1 of which is in the Monitoring & Controlling Process Group.

In essence, this is almost an exact parallel to the Time knowledge area which was covered in the last post, and is covered by chapter 6 of the PMBOK® Guide. The 2 Planning processes take high-level estimates and bring them down to a specific, practical, step-by-step level. The 1 Monitoring & Controlling process checks to see if the project is on track, in this case with regards to costs as opposed to schedule, and if it is not, manages changes that bring it back on track. However, there are only 2 planning processes as opposed to five, so the processes in this knowledge area are quite a bit simpler overall.

Process

Group

Process

Number

Process
Name
Process Description
Planning 7.1 Estimate Costs Developing an approximation of the monetary resources needed to complete project activities.
7.2 Determine Budget Sums up the estimated costs and add reserves to establish an authorized cost baseline.
Monitoring & Controlling 7.3 Control Costs Monitoring the status of the project to update project budget and manage changes to the cost baseline.

Let’s take a closer look at the process descriptions, taken from the PMBOK® Guide. I think if you pay attention to the essence of what each process is, you will see how they flow from one to the other.

7.1 Estimate Costs

Costs are estimated by various methods that are based on past projects, on top-down or bottom-up estimates, or on averaging between pessimistic, neutral or optimistic assumptions. This gives you an estimate or ballpark figure of the project costs.

7.2 Determine Budget

Here, in a parallel to 6.5 Determine Schedule, once you have the work packages broken down into billable units of work called activities, you can now start adding them up to get the project baseline. Add the reserves for those risks which you’ve planned for (contingency reserves) and you get the cost baseline. Finally add the reserves for those risks which you’ve NOT planned for (management reserves) and you get the cost budget.

7.3 Control Costs

Here you use the tools such as earned value to find out whether your project is proceeding according to plan or not. This gives you a precise basis for recommending what to do to get it back on track.

The next post will cover the next Knowledge Area, that of quality management.