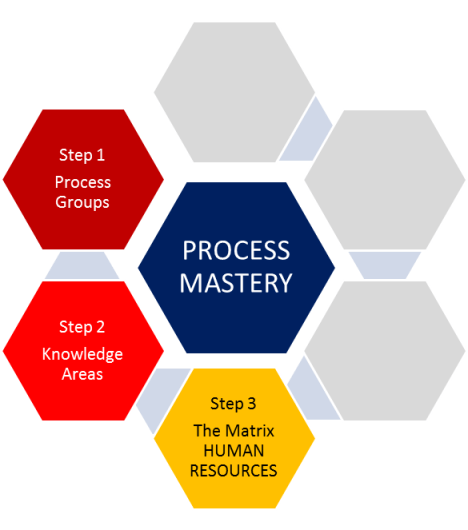
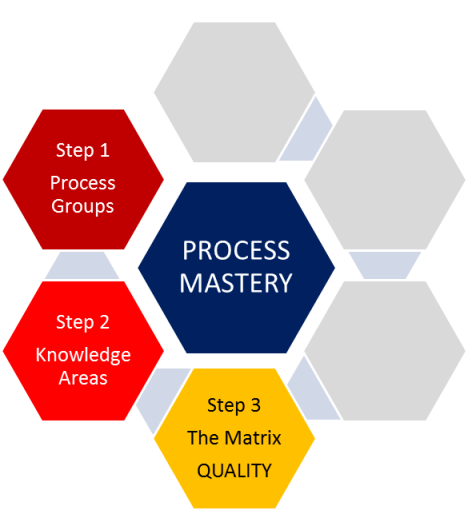
After memorizing the 5 process groups (step #1) and the 10 knowledge areas (step #2), the next step in mastering the memorization of the processes is figuring out where the 47 project management processes fit in the matrix made by those process groups and knowledge areas. The best way to do that is to first memorize the names and order of the processes by knowledge area. In previous posts, I have covered the knowledge areas of Integration (chapter 4 of the PMBOK® Guide), Scope (Chapter 5), Time (chapter 6), Cost (chapter 7), Quality (chapter 8), Human Resources (chapter 9), and Communications (chapter 10) This post will cover the processes involved in the Risk Management knowledge area, which is covered by chapter 11 of the PMBOK® Guide.
Here are the 47 processes of project management; the chart indicates how many are in each knowledge area and process group.
| Initiating | Planning | Executing | Monitoring & Controlling | Closing | ||
| Integration | 6 |
1 |
1 |
1 |
2 |
1 |
| Scope | 6 |
4 |
2 |
|||
| Time | 7 |
6 |
1 |
|||
| Cost | 4 |
3 |
1 |
|||
| Quality | 3 |
1 |
1 |
1 |
||
| Human Resources | 4 |
1 |
3 |
|||
| Communications | 3 |
1 |
1 |
1 |
||
| Risk | 6 |
5 |
1 |
|||
| Procurements | 4 |
1 |
1 |
1 |
1 |
|
| Stakeholder | 4 | 1 |
1 |
1 |
1 |
|
| 47 |
2 |
24 |
8 |
11 |
2 |
2. Risk Management knowledge area
Here’s the portion of the above matrix of 47 processes that lists the processes in the Risk Management knowledge area, which is covered in chapter 11 of the 5th Edition of the PMBOK® Guide.
| Knowledge Area | Total # of Processes | Initiating | Planning | Executing | Monitoring & Controlling | Closing |
| Risk |
6 |
5 | 1 |
You should notice two things about the distribution of processes among the process groups for the Risk Management knowledge area. First of all, there are no processes in the Executing Process Group; this is true of the three so-called “triple constraint” knowledge areas of Scope, Time and Cost. Secondly, this is like the Time management knowledge area in that there are a lot of planning processes. The Risk knowledge area has 5 out of 6 processes in the Planning Process Group (as opposed to 6 out of 7 in the case of the Time knowledge area), and is therefore next to Time the most complicated of the knowledge areas in terms of planning.
Here’s a chart describing all of the 6 processes, 5 in the Planning Process Group and 1 in the Monitoring & Controlling Process Group.
| Process Group | Process Number | Process Name | Process Description |
| Planning | 11.1 | Plan Risk Management | Defines how to conduct risk management activities on the project. |
| 11.2 | Identify Risks | Determines what risks may impact the project and documents their characteristics. | |
| 11.3 | Perform Qualitative Risk Analysis | Prioritizes risks for further analysis or action by assessing their probability of occurrence and impact. | |
| 11.4 | Perform Quantitative Risk Analysis | Numerically analyzes the effect of risks on overall project objectives. | |
| 11.5 | Plan Risk Responses | Develops options and actions to enhance opportunities and reduce threats to project objectives. | |
| Monitoring & Controlling | 11.6 | Control Risks | Implements risk response plans, tracks identified risks, monitors residual risks, identifies new risks, and evaluates risk process effectiveness throughout the project. |
11.1 Plan Risk Management
This planning process sets the framework for all of the other risk management processes by giving guidelines, providing templates for documents like the “risk register” that will be used throughout the various Risk Management processes, and listing definitions such as the various categories of risk that will be identified and analyzed. The output of this process is the Risk Management Plan.
11.2. Identify Risks
Risks are identified by the various groups of stakeholders using various information-gathering techniques and are organized and put in a risk register.
11.3 Perform Qualitative Risk Analysis
The risks identified in 11.2 Identify Risks are rated according to two variables, their probability and their impact. Whether a given risk has a) low or high probability and b) low or high impact determines what the general response to that risk should be. Does the company want to avoid the risk, mitigate it, transfer it, or simply accept it if it occurs. Or if it is a positive opportunity, on the other hand, does the company want to exploit the opportunity, enhance it, share it, or simply accept it if it occurs. For those risks that are simply accepted, they are put on a watch list to be monitored during the 11.6 Control Risk process.
11.4 Perform Quantitative Risk Analysis
The risks are furthered analyzed; in this case the risk goes from having a qualitative impact and probability description (low vs. high) to having an expected monetary value, which gives a quantitative measure of the severity of the risk.
11.5 Plan Risk Responses
The risks identified in 11.2, analyzed qualitatively in 11.3 and quantitatively in 11.4, are now planned for both in terms of resources and/or activities needed to reduce their impact on the project objectives. The funding required for these risk responses will become part of the contingency reserve, which is added to the project cost estimate in the Cost Management Process.
All of the above are done during the planning process. The following process is done during the Monitoring & Controlling Process.
11.6 Control Risks
This is where risks that were identified are tracked during the course of the project–do they end up occurring or not? If not, the contingency reserves that were set aside in case they did occur may no longer be needed. Of course, if the risks do occur, then if they were risks on the risk register, then the risk responses that were planned should be carried out using the resources set aside in the contingency reserves, which the project manager has control over. What if the risks were not planned for? Then a response still needs to be devised on the spot, and this is referred to as a workaround. In this case, the funding will not come from the contingency reserves, but another source, the management reserves, which are under control of management, not the project manager. This means that management must be informed if an “unplanned” risk occurs.
Corrective actions to take care of risks that have occurred are risk responses; there is another type of action, however, that is a preventive action, which helps prevent the risk from occurring in the first place.
Another type of control action is a periodic review of the risk register. Are any new risks identified during the course of the project; if so, they should be added to the risk register. Are there are any changes probabilities or impacts of any of the risks that are on the risk register? This analysis also needs to be carried out for the risks on the so-called “watch list” that have low probability and low impact. If a reassessment of these risks shows that some of them now have a higher probability and/or impact, they must be taken off the “watch list” and put on the risk register so that a risk response can now be developed.
To paraphrase the Serenity Prayer, a project manager should try to approach risk management using the serenity to prepare for the risks that cannot be avoided, to courage to prevent those risks that can, and the wisdom to know the difference.
The next post will cover the processes in Procurement Management, which is covered in chapter 12 of the PMBOK® Guide.
Filed under: Uncategorized | Leave a comment »