Agile PM Process Grid–3.14 Affinity Estimates (2)


In John Stenbeck’s book “PMI-ACP and Certified Scrum Professional Exam Prep and Desk Reference”, he creates an “agile project management process grid” which describes 87 processes used in agile project management.   These processes are divided into five process groups (Initiate, Plan, Iterate, Control, and Close), which are analogous to the five process groups in traditional project management, and seven knowledge areas which can be mapped, more or less, onto the ten knowledge areas in traditional project management.

In the last post, I wrote about affinity estimates, the process that brings the dimensions of priority and sizing to a group of user stories so that a Roadmap can be split up into a series of Releases, and then each Release can be subsequently broken down into Iterations.   This post goes through the step-by-step process of how to do this process.

  1. The team gathers and on the top of a whiteboard a scale is written, starting from extra small (XS) to the left to extra large (XL) to the right.
  2. A “parking lot” is defined to the side of the space defined above.
  3. Each team member is given an equivalent stack of User Stories written on cards.
  4. Each team member sizes each story relative to other stories.
  5. Each team member places each story on the board, with stories of the same size being placed within the same column.
  6.  Stories that are too vague to be sized are placed in the Parking Lot.

That is the first pass.   Here are the steps to the revision phase.

  1. Each team member reviews the user stories he or she placed and moves them to a different column if they believe they placed the user story incorrectly in the first pass.
  2. The first time a story is moved, a small diagonal line in the bottom right corner of the card.
  3. The second time a story is moved, another small diagonal line is placed in the bottom right corner of the card, this time forming an “X”.
  4. If a story must be moved a third time, the story is deemed to be too vague and is moved to the parking lot space.

Here are the steps to the final phase.

  1. Vague stories that are in the parking lot space are discussed as to what clarification is necessary, such as acceptance criteria, tests to be identified, etc.

The resulting Affinity Board shows all of the stories that are understood to be part of the plan, and shows their relative size of each story.

Then the stories can be ranked in terms of priority so that the user stories in the Roadmap can be grouped into stories that have the same priority, and these can designated as being Release #1, Release #2, etc.

This completes the processes that are involved in Adaptive Planning during the planning phase.   The next post covers the next knowledge area, that of Team Performance.


Agile PM Process Grid–3.14 Affinity Estimates (1)


In John Stenbeck’s book “PMI-ACP and Certified Scrum Professional Exam Prep and Desk Reference”, he creates an “agile project management process grid” which describes 87 processes used in agile project management.   These processes are divided into five process groups (Initiate, Plan, Iterate, Control, and Close), which are analogous to the five process groups in traditional project management, and seven knowledge areas which can be mapped, more or less, onto the ten knowledge areas in traditional project management.

Today’s post comes at the end of a block of processes that are in the Adaptive Planning knowledge area (the equivalent of Time and Cost Management in traditional PM), and are done during the Planning process group.

The previous processes dealt with estimation of the size of user stories, that is, the relative amount of effort required by the team to develop them  to fruition.   The process for this post, 3.14 Affinity Estimates, deals with the sizing of a large number of user stories, used when planning on a larger scale such as a Roadmap or Release.

As a reminder, a Roadmap is the equivalent of a program level of plan for a sequence of Releases of the product or service.    How does the “affinity estimate” approach deal with this large number of user stories?   In a nutshell, it uses a large board on which there are two dimensions to be concerned about, the priority and the sizing of the stories.   The stories that have higher priority (the “must have” features rather than the “it would be nice to have” features) get placed at the TOP of the board and the stories with lower priority get placed at the BOTTOM of the board.    This dimension is the “affinity” part of the “affinity estimating” process.   Those stories that have the same affinity in terms of priority will get grouped together for release number 1, release number 2, etc.   This will give the Releases involved in the Roadmap.

For the other, horizontal dimension, those stories that are smaller in size get placed at the LEFT side of the board and the stories that are larger in size get placed on the RIGHT side of the board.   This dimension is the “estimating” part of the “affinity estimating” process, and this will give the relative size of the user stories in any given Release.

This gives the general idea of the process.   For the step-by-step recipe on how to do the process, go to the next post…

Agile PM Process Grid–3.13 Ideal Days


In John Stenbeck’s book “PMI-ACP and Certified Scrum Professional Exam Prep and Desk Reference”, he creates an “agile project management process grid” which describes 87 processes used in agile project management.   These processes are divided into five process groups (Initiate, Plan, Iterate, Control, and Close), which are analogous to the five process groups in traditional project management, and seven knowledge areas which can be mapped, more or less, onto the ten knowledge areas in traditional project management.

Today’s post is about an estimating technique called ideal days or sometimes referred to as ideal time.   Actually it’s the start of an estimating technique, which is refined in using actual days or actual time.

What are ideal days?   They are the unit of measure expressing the work time required to complete an activity assuming that there are no interruptions so that work can be completed with 100% efficiency.    Now how realistic is a work day that assumes no interruptions?   Not very.

That’s why the next step in estimating the work time required to complete an activity is actual days.    This is a refinement of the ideal days estimate, but this time with the assumption that typical interruptions will occur and reduce the 100% efficiency rate to a lower rate.

However, as John Stenbeck points out in his book is that even this correction is difficult to estimate.    How does one estimate a “typical interruption”?    How does that typical interruption actually reduce the efficiency?   It’s a greater idea for estimation, but harder to implement than it looks.

This is why the preferred method is to use story points, process 3.12.  Although this seems to be less precise because it is a relative, rather than an absolute, estimating method, it ends up using the collective brainpower of the group to come up with the size of user stories relative to each other, from which a total estimate can be made using the next process, 3.14 Affinity Estimating, which is the subject of the next post.

Agile PM Process Grid–3.12 Story Points


In John Stenbeck’s book “PMI-ACP and Certified Scrum Professional Exam Prep and Desk Reference”, he creates an “agile project management process grid” which describes 87 processes used in agile project management.   These processes are divided into five process groups (Initiate, Plan, Iterate, Control, and Close), which are analogous to the five process groups in traditional project management, and seven knowledge areas which can be mapped, more or less, onto the ten knowledge areas in traditional project management.

The process covered in this post is actually a tool, and that is story points.   Story points are used to quantify the work effort at a high-level by giving an indicator of how much difficulty will be involved with the development of a given user story.

They are used often in conjunction with the process 3.11 Planning Poker (see previous post).  Story points are expressed in terms of numbers in the Fibonacci sequence 1, 2, 3, 5, 8, 13, 21, …, and these are used because they form the basis of many natural forms and the human mind seems predisposed to their use.   The relative size of user stories can be estimated using story points, and their intuitive nature makes them easy to use in the first part of agile estimation.

The next post deals with the concept of actual days, as opposed to ideal days, and their importance in the agile estimation process.

Agile PM Process Grid–3.11 Planning Poker


In John Stenbeck’s book “PMI-ACP and Certified Scrum Professional Exam Prep and Desk Reference”, he creates an “agile project management process grid” which describes 87 processes used in agile project management.   These processes are divided into five process groups (Initiate, Plan, Iterate, Control, and Close), which are analogous to the five process groups in traditional project management, and seven knowledge areas which can be mapped, more or less, onto the ten knowledge areas in traditional project management.

Today’s post is about the process 3.11 Planning Poker, which is a tool used as part of doing the process 3.8 Sizing.  Sizing is the process of estimating the relative amount of development effort needed to complete a user story.   Planning poker is a tool used to accomplish this.

  1. Out of all the user stories, the team chooses a story that represents a midpoint, which could be referred to as a “medium” size user story.   Usually this story is given a value on the Fibonacci scale, typically 5 or 8 story points.
  2. Each successive story is shown to the team, together with a brief discussion to clarify what it entails.   Then each member of the team makes an independent vote with a deck of cards that have Fibonacci numbers on them.   So if the user story is about the same difficulty as the first “medium” story, then a person would assign it an “8”, let’s say, if that was the number assigned to the midpoint story mentioned in the paragraph above.   If it is a smaller user story, then each member of the team assigns it a value from 1, 2, 3, or 5; likewise, if it is a larger user story, the team member assigns it a value or 13, 21, or larger.
  3. The votes are compared, and the person or persons who gave the lowest score out of the range of numbers given as a a vote has to explain the reason for the outlier estimate; likewise the person or persons with the highest score of the range of numbers must explain their vote as well.
  4. A revote is done until a consensus on the size of the story.
  5. If there is no consensus reached, then this could be because the story is too vague to be effectively estimated, and it is returned to the customer/proxy for further clarity.
  6. If there is a largest value allowed for a user story, say 21, and a consensus is reached that the particular user story is larger than the allowed maximum, then that story is returned to the customer/proxy for further decomposition.

John Stenbeck recommends that the Planning Poker meeting be facilitated by someone outside the team, either an agile coach or a Scrum Master from a different team.

Now the two dimensions of priority and size of a user story are combined in a process 3.12 Affinity Estimates, which is the subject of the next post.

In the next post, I will discuss how the three elements of a cross-functional team, planning poker, and Fibonacci numbers can help reduce three significant risks associated with estimating and sizing (processes 3.8 and 3.9).

Agile PM Process Grid–3.10 Wideband Delphi


In John Stenbeck’s book “PMI-ACP and Certified Scrum Professional Exam Prep and Desk Reference”, he creates an “agile project management process grid” which describes 87 processes used in agile project management. These processes are divided into five process groups (Initiate, Plan, Iterate, Control, and Close), which are analogous to the five process groups in traditional project management, and seven knowledge areas which can be mapped, more or less, onto the ten knowledge areas in traditional project management.

The post for today deals with the consensus-based estimating method that is used in agile, but has its origin in the Delphi method that was originally created by the Rand Corporation.

In the original Delphi technique, a question was posed to a group of experts who gave their answers independently.    The answers were revealed, and it was seen whether a consensus developed from those answers or not; if nor, more rounds of the technique were used until such consensus was reached.

The “Wideband Delphi” is where a question is posed to the entire development team, which is where the word “Wideband” comes in.How is “Wideband Delphi” the same as the original Delphi technique, and how is it different?   Well, it is the same in that a question, or series of questions, is posed to a team of people, and each person on that team gives their independent answer to that question.

How is it different?   Well, first of all it is not an outside group of experts, but rather the development team that is being posed the questions.   And the questions involved in this case have to do with estimating the size of a series of user stories.

The team first asks the customer/proxy questions about assumptions, constraints, and risks associated with the project.   Then the team returns to their workspace and each member of the team creates an estimate of all of the user stories.

Again, like the original Delphi technique, the individual estimates are revealed, and then the team can further discuss the range of estimates to see if it can be narrowed.   Sometimes a round of silent voting is done until a consensus estimate is achieved for each user story.

The process concludes when the facilitator composes

  • the list of user stories
  • the consensus estimates for each user story
  • the assumptions for each user story
  • a list of subtasks associated with each user story

and the results are presented to the team and the customer/proxy.

Historically, the “Wideband Delphi” preceded the “Planning Poker” technique which is the subject of the next post.

Agile PM Process Grid–3.8 Estimation and 3.9 Sizing


In John Stenbeck’s book “PMI-ACP and Certified Scrum Professional Exam Prep and Desk Reference”, he creates an “agile project management process grid” which describes 87 processes used in agile project management. These processes are divided into five process groups (Initiate, Plan, Iterate, Control, and Close), which are analogous to the five process groups in traditional project management, and seven knowledge areas which can be mapped, more or less, onto the ten knowledge areas in traditional project management.

Today’s post discusses both the process 3.7 Estimation and process 3.8 Sizing.   In previous posts I discussed the principles behind these processes,  and in the current post, I want to reiterate John Stenbeck’s explanation of how they address three significant risks related to the estimation process in general.    Planning poker (process 3.11) and the use of Fibonacci numbers were addressed in the last post.

  1. Any group faces the pressure to conform to the group’s worldview; this process is sometimes referred to as group think.   One of the ways Japanese avoid this process is by having the youngest person state their opinion first.    Japanese society respects seniority to a greater degree than American society, in general, and they recognize that if the more senior members of the team were to state their opinion first, there would be a lot of pressure for the younger person to conform to the opinion just stated by their superiors.   This pressure exists in American society, as well, however, although not to such great extent.    A way to reduce the pressure is to have each team member reveal simultaneously his or her vote regarding what size a particular user story should be.   In this way, no one is pressured beforehand to conform to any opinion but their own.
  2. Any group faces the pressure to do things the way they have always been done.    A person who argues from this standpoint is said to be anchoring his or her opinion.   The problem with an anchor, of course, is that a boat cannot move anywhere while the anchor is deployed.   So after a person gives a vote for the size of a particular user story, he or she is expected to justify that decision within the context of the project itself and not to justify it by reference to previous projects.
  3. Any group faces the pressure to defer to experts, those that have experience within a certain field of expertise.   However, many of the biggest breakthroughs come from non-experts because they are viewing the situation with fresh eyes.    The so-called experts may have just absorbed the “received wisdom” which is based on assumptions that may end up not being true after all.   Thus each member votes on the size of every story, and not just those within their particular field of expertise.   This is the way to get ideas that challenge the status quo.
The Planning Poker process 3.11, which asks a team of people to size user stories in a way that allows each team member to voice his or her opinion, is a powerful process.   If you need experts, one way to duplicate the power of this estimating method is to use a process called 3.10 Wideband Delphi, which is the subject of the next process.

Agile PM Process Grid–3.9 Sizing (2)


In John Stenbeck’s book “PMI-ACP and Certified Scrum Professional Exam Prep and Desk Reference”, he creates an “agile project management process grid” which describes 87 processes used in agile project management.   These processes are divided into five process groups (Initiate, Plan, Iterate, Control, and Close), which are analogous to the five process groups in traditional project management, and seven knowledge areas which can be mapped, more or less, onto the ten knowledge areas in traditional project management.

Today’s post is about the process 3.9 Sizing, which is part of the Adaptive Planning knowledge area.   When sorting out the various user stories that the development team is working on, there are two dimensions to be aware of.   The first dimension is that of “priority”, and the process of sorting out user stories based on priority is process 1.7 Prioritization.   The second dimension is that of “size”, and the process of sorting out user stories based on “size” is this process 3.9 Sizing.

I talked about this process in the last post, and wanted to continue the discussion in this post with an introduction to “planning poker.”   Let’s say that you have created a set of user stories, and your next task is to “size” them, that is, to define the relative development effort required to complete each story.

Planning poker is a process which can help in this sizing effort.   Before explaining the process, a preliminary explanation of the Fibonacci sequence is needed.

This is a sequence generated by taking the pair of numbers 1 and 1 and adding them to make 2.  Then the last of the pair, 1, is added to the sum, 2, to get the next number in the sequence, or 3.   Then 2 and 3 are added to make 5, 3 and 5 are added to make 8, 5 and 8 are added to make 13, etc.

Although this is desca0 ribed as a mathematical sequence, as Pythagoras would say, “all is based on number,” and the Fibonacci sequence appears in nature in forms such as spirals or fractals (shapes that show self-similarity at varying scales, such as clouds, leaves, mountains, etc.).   It is because they are found in nature, and the fact that man often imitates nature in art, that these numbers inform the architecture of civilizations as diverse as the ancient Greeks to modern-day Africa.   Why are they used in agile?   Because they form a very human, intuitive way of comparing various quantities.

Now with that introduction to Fibonacci numbers out of the way, let me explain how Planning Poker works.  Out of all the user stories, the team chooses a story that approximates a midpoint, and this is called a “medium” size user story, and assigned a numeric value of 8 story points.  Then the remainder of the stories are estimated using Fibonacci sequence numbers such as 1, 2, 3, or 5 for smaller stories, and 13 or 21 for larger stories.   Each player has a deck of numbers with Fibonacci sequence numbers on it, and gets a vote for each user story.    The votes are revealed, and discussion and re-voting as necessary are done until there is a team consensus on the size of each story.

In the next post, I will discuss how the three elements of a cross-functional team, planning poker, and Fibonacci numbers can help reduce three significant risks associated with estimating and sizing (processes 3.8 and 3.9).

Agile PM Process Grid–3.9 Sizing


In John Stenbeck’s book “PMI-ACP and Certified Scrum Professional Exam Prep and Desk Reference”, he creates an “agile project management process grid” which describes 87 processes used in agile project management.   These processes are divided into five process groups (Initiate, Plan, Iterate, Control, and Close), which are analogous to the five process groups in traditional project management, and seven knowledge areas which can be mapped, more or less, onto the ten knowledge areas in traditional project management.

Today’s post is about the process 3.9 Sizing, which is part of the Adaptive Planning knowledge area.   When sorting out the various user stories that the development team is working on, there are two dimensions to be aware of.   The first dimension is that of “priority”, and the process of sorting out user stories based on priority is process 1.7 Prioritization.   The second dimension is that of “size”, and the process of sorting out user stories based on “size” is this process 3.9 Sizing.

First of all, what is “sizing”?   It is an agile estimating technique used to define the relative development effort required to complete user stories.   The word “relative” is important:   rather than saying “user story #5 will take five weeks”, you might say “user story #5 is a Medium user story,” if you use the sizing convention that is analogous to clothing sizes, namely, S, M, L, XL.

Here are the three units of measure a story’s size is usually specified with:

  1. Ideal days–the work time required to complete an activity assuming there are no interruptions so that work can be completed with 100 efficiency.   The problem with using this absolute measure of work time is that different team members have different work experience, skills, and approaches to the work, so coming up with a “typical” or “average” speed for the team is difficult.
  2. Actual days–the work time required to complete an activity assuming typical interruptions in the workplace that reduce efficiency from the theoretical 100% used to estimate “ideal days.”  Although this would seem to be an improvement on the “ideal days” measure, cataloguing all of the factors that reduce ideal days to actual days is difficulty, and prevent “actual days” from being a useful measure.
  3. Story points–as opposed to the more “absolute” time estimates discussed in the two paragraphs above, “story points” are units of measure used to quantify the work effort and complexity required to develop a particular user story relative to other user stories.   They provide a relatively quick, high-level indicator of how difficult the development of any particular user story will be.
To go into how the sizing process works with story points, I will have to discuss the “planning poker” tool and the Fibonacci sequence of numbers.   This I will do in the next post.

Multilingual Learning Plan for 2016


I’ve been enthused about language learning all my life, but my discovery of Benny Lewis and his multilingual abilities at his website fluentin3months.com has really inspired me to expand my fluency in several languages.   I started a premium-level subscription to his site last year to gain tips and tricks for how to become more fluent in the languages I’ve studied.   I updated to his 2.0 version of his premium-level subscription in November, and the great content just got better.

1.  Keeping Your New Year’s Resolution

One of the things he encourages those members of his community to do is to set out a plan on how they want to tackle a new language in the coming year.   See his post on keeping a New Year’s Resolution with regards to learning a new language (or improving your fluency in one you already know).

How to Make a New Year’s Resolution and Actually Keep It

His main tips are:

  1. Create goals that are specific and measurable
  2. Allow yourself to feel a sense of accomplishment and progress
  3. Know your limitations and don’t let setbacks derail your momentum
  4. Use tools to track your progress

These tips are good for any goal, not just ones having to do with learning languages, by the way.

2.  How to create specific and measurable language goals.

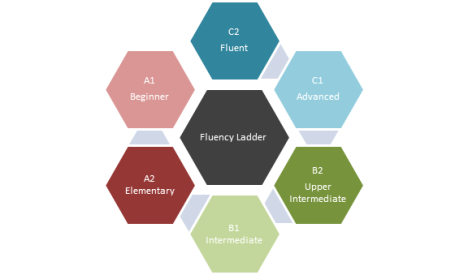
One way to measure your specific fluency level is to use the Common European Framework of Reference for Languages.  There are six fluency levels, with A1, A2 being the levels needed to survive in a country, B1, B2 being the levels needed to live in a country, and C1, C2 being the levels needed to thrive in a country.

This framework has been influential worldwide because China’s proficiency exams have been changed to conform to this framework.

Level Explanation
A1 Beginner Can introduce oneself and understand familiar everyday expressions.
A2 Elementary Can describe oneself and communicate about one’s immediate environment.
B1 Intermediate Can talk about past and future events and about most situations encountered at work or school.
B2 Upper Intermediate Can communicate about simple ideas and concepts in a way that is generally understood.
C1 Advanced Can communicate about complex ideas and concepts in a way that is easily understood.
C2 Fluent Can summarize complex idea and concepts and create coherent presentations.

So when you start to learn a new language, your first goal should be to reach the “A1” level.   Once you’ve achieved that, you can go on to A2, etc.   The rough rule of thumb is that is takes twice as much time to go to each higher level than the one before.   How much time it takes to go up any particular level depends on a) your consistency, b) the difficulty of the language, usually measured by how far it is on the linguistic “tree” of languages from your own (so Chinese takes three times as much time per level as Spanish for an English speaker).

3.  My Multilingual Plan

Last year around this time I put together a “multilingual plan for 2014.”   Today I put forward my new plan for 2016.

Last year, I put down what my plan was for each language, but this year I’m doing things differently.   I’m listening the language app, and then what languages I’m studying on it.

a.  Duolingo

I’m using Duolingo to study various languages.   I have languages that are on …

  • high rotation (once a day):  Spanish, French, German, Italian, Portuguese
  • medium rotation (twice a week):   Dutch, Danish, Irish, Swedish, Turkish
  • low rotation (once a week):   Norwegian, Ukrainian, Esperanto, Russian, Polish

For each language, I practice two skills which gives me 20 experience points (10 for each skill).   For the high rotation languages, my goal is to finish the entire skill tree by the end of the year.   This puts you at around B2 level fluency, and after that you go to the translation skill tree, which I first want to try with Spanish.

b.  Memrise

The problem about Duolingo is that it doesn’t really handle languages very well that don’t use the Latin-based alphabet.   So for Mandarin Chinese, Japanese, and Korean, I use this app once a day.

c.  Foreign Service Institute, Defense Language Institute

Duolingo helps with vocabulary, and understanding individual utterances, but doesn’t help you memorize vocabulary patterns or gain fluency in conversation.   For this I use the courses on Foreign Service Institute for the same courses that are in high rotation on Duolingo, namely, Spanish, French, German, Italian, and Portuguese.    These I end up listening to about twice a week.

For Arabic, I had to turn to the Defense Language Institute recordings, because they not only have the general Modern Standard Arabic (MSA), but the Egyptian and Syrian dialects as well.

d.  Rosetta Stone

I’m using this to study Arabic (MSA), because at the end of every other lesson you can have a 30-minute session with a native speaker to monitor your progress.

e.  TBD

This year, I plan on taking the HSK (Hanyu Shuiping Kaoshi) test for Mandarin Chinese.   I have passed it at the B1 level and am working towards the B2 level.   I think I will need to get a Chinese tutor for this, and I’m looking into various services that I can use.

How do I study all these languages at the same time?   Well, I’m passionate about learning languages, and your mind is always creative in the ways it can find time for something you are passionate about!

  1. I subscribe to the List app, which helps you create and maintain daily habits through the power of social media.    This helps you create a consistent practice:   even if you study for only 5 minutes every day, this is better than studying 30 minutes every week!   Benny Lewis recommends Memrise, which I now use on a regular basis.
  2. I listen to foreign language recordings while driving, in particular my language recordings from the FSI courses mentioned above.
  3. I listen to language recordings while doing housework.  It takes away the drudgery of routine physical tasks by listening to foreign languages while doing it.   You’ll reorder your brain while putting order into your environment. 
  4. Finally, the proof of language learning is in the speaking, and I plan to find incorporate the learning of foreign languages through Benny Lewis’ Conversation Partners and through professional teachers at Italki.    

These are some creative ways I try to use my time so that I can do something as audacious as to follow Benny Lewis’ lead, whom I mentioned at the beginning of the post.   My goal is to gradually move up in all of the languages I’ve already studied, while using Duolingo to introduce myself to new languages at the very basic level.    Learning languages exercises the brain, and it provides you with a unique form of empathy towards the various cultures of the world.   Let’s see how far I can go in 2016!