5th Edition PMBOK® Guide—Chapter 11: Risk Strategies


1.   Introduction

The fifth of the six processes devoted to risk  management is that of 11.5 Plan Risk Responses.   Out of the six processes, five are done during the planning process and the sixth one is done during the course of the project during the monitoring and controlling process.

This fifth process uses several tools to come up with risk responses that are specific to that risk, but before you come up with a specific response, the first step is to come up with a general risk strategy for the risks that you have identified and analyzed in earlier planning processes.    That is the subject of this blog post.

2.  General Risk Strategies

There are four general strategies for dealing with risk, depending on whether they are negative risks (threats) or positive risks (opportunities).  Which strategy to use depends on two factors:  the probability of the risk occurring and the impact that it would have on the project if it were to occur.  For the sake of simplicity, let’s categorize both the probability and impact of a risk into high and low categories.  Then we have the following matrix for negative risks and positive risks:

Probability Impact Strategy (-) Strategy (+)
High High Avoid Exploit
Low High Transfer Share
High Low Mitigate Enhance
Low Low Accept Accept

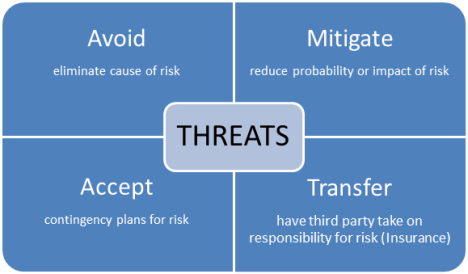
3.  Strategies for negative risks or threats

a.  Accept

As can be seen, if the risk is low in terms of probability and impact, you can simply accept it.   Accepting a risk does not mean ignoring it:  risks in these categories that are accepted are put in a watch list.   During the course of the project, this watch list should be reviewed to see if the probability and/or impact of the risk has increased.

b.  Avoid

On the opposite end of the scale, if the probability and impact are high, you should so all you can to avoid that risk.    Some ways of avoiding risk are by clarifying requirements so that the potentially high-risk portions of the scope are excluded, or if the risk is to the schedule, by extending the schedule.

c.  Transfer

Now, if the impact is high and the probability is low, you may want to transfer  the risk to a third party.    Examples in the case of manufacturing would include the purchasing of product liability insurance or, if the risk has to do with a certain component, outsourcing the manufacturing of that component to a company that is better equipped to handle it.

d.  Mitigate

A fourth strategy occurs when either the impact or the probability is high, and that is to mitigate the risk by lowering the probability of it occurring, or reducing the impact on the project if it occurs.

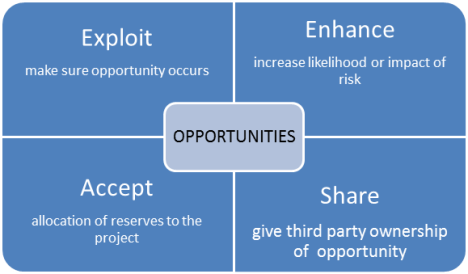
4.   Strategies for positive risks or opportunities

Now the “flip side” of negative risks are positive risks are opportunities.     Going in parallel order to the explanation of the four risk strategies of negative risks above, you have:

a.   Accept

If the probability of an opportunity is low and the impact on the project would be low, then you should not actively pursue it because that would be waste of resources, but rather watch out for it and take advantage of it if it occurs.

b.  Exploit

If the probability of an opportunity is high and the positive impact on the project would be high as well, then you should identify and maximize the probability of occurrence of those events that which would trigger an opportunity in order to exploit it.   For example, if there would be a significant cost savings for the project to be done early, then it might be worthwhile spending extra resources to do so, provided of course that the extra resources are more than made up by the cost savings.

c.  Share

What if you have an opportunity that has low probability of occurring, but would have a high positive impact on the project?  In this case you would share the opportunity with a third party that could best capture the opportunity in order to benefit the project.    Examples of this include forming risk-sharing partnerships, teams, special-purpose companies or joint ventures.

d.  Enhance

If there is an opportunity that has low probability of occurring, then it might be worthwhile to add resources to increase the probability of its occurring.

5.  Conclusion

In each case, the idea is to categorize the risk in general terms based on its impact and probability, and then use a general strategy which would be of most benefit to the company.   The four general strategies for dealing with risk are based on these two factors, and whether the risk is a positive one (opportunity) or negative one (threat).    It is best to memorize these four strategies by considering WHY they are used in terms of impact and probability, and to recognize that the four strategies of dealing with positive risk are mirror images of the strategies of dealing with negative risk.

Toastmasters Speech Contest–Five Ways to Participate


It’s the height of the summer, when parents are starting to plan for their kids to return to school.   In Toastmasters International, it’s time for clubs to start planning for their Fall Speech Contests.

As  a Vice President Education, it’s my duty to support the Toastmasters International educational program for all of my club’s members.    I consider the Speech Contests to be not just a nice extra to the regular educational program that goes on every week at our Toastmasters Club, but a vital part of that educational program.

1.   Be A Contestant

I always encourage members to join the Speech Contest as contestants.   Some are worried about competing against others who are better than they are and not winning.   What I say to that is this:   you are in it to be a better speaker period.   Let me use an analogy of going to the gym.    If you go to the gym, do you get any health benefit from being stronger than the next person?    No!   You only get a health benefit if you are stronger than YOU used to be because of your efforts at the gym.   In a similar way, whether you win or lose the contest, you will always win as a personal matter if you go with the attitude that your goal is to be a better speaker.    And for those that are ambitious at trying to improve their speaking ability, that  ambition to improve will win out over any fear they might feel, so you have to encourage that aspect when you talk to them about being a contestant.

I feel a personal triumph in this area because in my previous club, I tried for TWO years to get someone other than me to join the contest, and I succeeded in the Spring contest this year in getting someone to join the Evaluation contest.    Now, since I’ve moved to Chicago and joined a new Toastmasters club, I was able to get FOUR people to join the contest, two for the Evaluation and two for the Humorous contest.    That’s progress!

2.  Help Put on the Club Contest

For those who are not quite ready for that step, I encourage two additional ways to participate in the Speech Contest.   In order for there to be a Speech Contest, there have to be contestants, of course, but there always have to be a group of people running the contest.    And here is where there are opportunities for members in the club to participate in the process, support their fellow club members who are contestants, AND gain credit in their Competent Leadership Manual for doing so.

3.  Be a Test Speaker

But a third way of participating in the Fall Speech Contest is to participate in another club’s contest by being a test speaker.   You see, in the Fall, District 30 here in the Chicagoland area is doing the Evaluation and the Humorous Speech Contest.   For the Evaluation Contest, you need a test speaker from another club to come in and do a speech, usually one from the Competent Communicator Manual, so that the Evaluators have a chance to each evaluate the same speech.

But if your club is supplied a test speaker by the Area Governor, that means your club has a chance to provide a test speaker to THAT club, as a neat exchange.    And this gives someone who is really ambitious and trying to complete their Competent Communicator manual an additional chance to speak.

4.   Attend the Area Contest

If you aren’t participating in the club contest, or if you enter the club contest and lose, you can STILL help out your club by going to the next level or area contest and supporting the representative from your club when he or she makes her speech.  I’ve done this in the past  and I can tell you the person doing the speech really appreciated my support.    (He won second place in the contest, which is great considering it was his first contest ever!)

5.  Help Put on the Area Contest

Of course I encourage club members to go and support whoever will in our Club Contest and who thus is going to be our representative in the Area Contest.   But just like the Club Contest, it takes a group of people running the contest to make it work.    And the Area Governor, who puts on the Area Contest like the VP Education helps put on the Club Contest, will definitely be looking for volunteers from the various clubs in his or her Area.    And here’s the great thing about participating in the Area contest–you get to support your club member who’s in the contest AND you help out the area contest.    It’s a great way as an Area Contest volunteer to meet the people in the other clubs and gain your first experience at networking within Toastmasters at the next highest level than your club.

I found that those who volunteered at the Area contest were enthusiastic about their own Toastmasters Club when they returned because they got to see a glimpse of the wider world outside the club, and they got to see some really impressive and entertaining speeches besides.

So each way of participating boosts one’s enthusiasm AND one’s confidence, so consider explaining all of these opportunities to those in your club!    It reminds me of a saying of Plutarch, who once said “the mind is not a vessel to be filled, but a fire to be kindled.”   Start getting some fires kindled in your club!


5th Edition PMBOK® Guide—Chapter 11: Process 11.5 Plan Risk Responses


1.  Introduction

The five risk-related project management processes in the Planning Process Group deal with setting up the Risk Management Plan (process 11.1), identifying (process 11.2), analyzing (processes 11.3 and 11.4), and then developing responses for risks to the project (process 11.5).

This post is devoted to the Inputs, Tools & Techniques, and the Outputs of the fifth of  these five processes, 11.5 Plan Risk Responses.

2.  Inputs

The main inputs comes from the risk management plan and the risk register.

11.5  PLAN RISK RESPONSES
INPUTS
1. Risk Management Plan The components of the risk management plan that are inputs to the process are:

  • Roles and responsibilities
  • Risk analysis definitions
  • Schedule for risk reviews
  • Risk thresholds for low, medium, high risk
2. Risk Register The pieces of information in the risk register that are used as inputs to the process are:

  • Identified risks
  • Root causes of risks
  • Lists of potential responses
  • Risk owners
  • Risk symptoms and warning signs
  • Relative risk rating or priority list of risks
  • Near-term (urgent) risks requiring responses
  • Risks for additional analysis and response
  • Trends in qualitative analysis results
  • Watch list (low priority risks)
TOOLS & TECHNIQUES
1. Strategy for negative risks or threats The following are the strategies for handling negative risks (aka threats)

  • Avoid
  • Transfer
  • Mitigate
  • Accept
2. Strategy for positive risks or opportunities The following are the strategies for handling positive risks (aka opportunities)

  • Exploit
  • Share
  • Enhance
  • Accept
3. Contingent response strategies Responses designed only if certain events occur.
4. Expert judgment Input from knowledgeable parties pertaining to actions to be taken with regard to a particular risk.
OUTPUTS
1. Project Management Plan  Updates
  • Schedule management plan—updates to the schedule strategy
  • Cost management plan—updates to the cost strategy, contingency reserves
  • Quality management plan—changes with respect to requirements, quality assurance, or quality control
  • Procurement management plan—changes in procurement strategy (make-or-buy decision, contract type)
  • Human resource management plan—updates to staffing management plan
  • Scope baseline—updated because of work generated by risk responses
  • Schedule baseline—updated because of work generated by risk responses
  • Cost baseline—updated because of work generated by risk responses
2. Project Documents Updates Risk register is updated to include:

  • Risk owners
  • Agreed-upon risk response strategies
  • Specific actions to implement the chosen response strategy
  • Trigger conditions, symptoms, or warning signs of a risk occurrence
  • Budget and schedule activities required to implement risk responses
  • Contingency plans and triggers that require their execution
  • Fallback plans if primary risk response proves inadequate
  • Residual risks that remain after planned risk responses have been taken
  • Secondary risks that arise as direct outcome of implementing a risk response
  • Contingency reserves calculated on the basis of quantitative risk analysis and organization’s risk thresholds

3.  Tools & Techniques

There are four strategies for dealing with negative risks or threats:  1) avoid, 2) transfer, 3) mitigate, and 4) accept and four parallel strategies for dealing with positive risks or opportunities:  1) exploit, 2) share, 3) enhance, and 4) accept.  Contingency response strategies are those which trigger responses only if certain events occur.  Expert judgment is used in putting together risk response strategies.

4.  Outputs

Both the risk register and the risk management plan are updated as a result of this process.

The next post will go into the strategies for dealing with negative risks and positive risks in more detail.

5th Edition PMBOK Guide®–Chapter 11: Quantitative Risk Analysis and Modeling Techniques


Out of the six processes devoted to risk management in the 5th Edition of the PMBOK® Guide, five of them are planning processes and one is in the monitoring & controlling process group.    The five planning processes set up the guidelines for risk management of the project, identify risks, analyze risks quantitatively and qualitatively, and then set up risk responses.

Process 11.4 Quantitative Risk Analysis takes the risks that were ranked in terms of their probability and impact in process 11.3 Qualitative Risk Analysis, and now takes the analysis a step further by attaching an actual dollar amount to the risk based on the impact that it might have on the project weighted by its probability of occurring.

This post will discuss some of the tools & techniques used to do this quantitative risk analysis.

1.  Sensitivity analysis

How sensitive is the project to risks that might occur during the course of the project?   This is the question answered by sensitivity analysis.   The negative or positive impacts of risk events are estimated, and those risks that have the highest level of uncertainty, measured by the spread between the negative and positive impacts for those risks, are the ones that are the most sensitive.    Sometimes, a tornado diagramso called because of its tapering funnel shape, is used to represent these spreads between the negative and positive impacts of risks.

2.   Earned Monetary Value (EMV)

This is used for calculating the average outcome that might occur if an event happens.   This is done by multiplying the probabilities of various outcomes occurring times the monetary impact if they do occur, and then adding all of these up.  For example, if there is a 75% probability of a certain part costing $1000, and $25% probability of it costing $2000, the average weighted cost will be (75% X $1000) + (25% X $2000) = $750 + $500 = $1250.

3.  Modeling and simulation

Essentially, EMV is a “retail” version of finding the average outcome of a specific event; the Monte Carlo technique is a “wholesale” version of the same concept, except it finds the average outcome of an entire project.    The probabilities of various events occurring during the project are multiplied times their potential impacts on the project.    Since there will be a range of uncertainty for each event, the simulation is done over and over again and the average weighted impact over all of the simulations gives the range of impact for the entire project.

This is just a thumbnail description of these three techniques, but the important thing to understand is that these tools & techniques, particularly the second and third, give actual numbers that quantify the risk impacts on a project.   The results of these quantitative analyses can be used to justify expenditures to mitigate those risks, or to perhaps handle in a different way (transferring them to another company by having them do the risky activity, etc.).

The responses to the risks are developed in the next process, and that is the subject of the next post.

5th Edition PMBOK® Guide–Data Gathering and Representation Techniques for Risk Management


1.  Introduction

There are six risk management processes according to the 5th Edition PMBOK® Guide, five in the Planning Process Group and one in the Monitoring and Controlling Process Group.     The fourth out of five planning processes is 11.4 Perform Quantitative Risk Analysis.    Based on the guidelines set up in the Risk Management Plan (output of process 11.1), risks were identified (process 11.2), and then give a risk rating based on the three factors of a) likelihood of the risk, b) impact of the risk, and in some cases c) the urgency of the risk (how early in the project it is likely to appear).    These risks are ranked based on the risk rating from those with high or moderate severity, to those low-level risks which are simply accepted and put on a watch list for further monitoring.

In the process 11.4 Perform Quantitative Risk Analysis, these risks which were qualitatively analyzed are now quantitatively analyzed, which in practical terms means that the probability and impact of these risks are specified, and the product of these is called the expected monetary value, which gives a more precise measure of the impact of a given risk on the product weighted by its likelihood of occurring.

In order to make this transition from quantitative to qualitative analysis, many tools are used in the course of the process.   This blog post covers the first of the tools & techniques listed for this process, namely the data gathering
of interviewing and the data representation technique of probability distributions.

2.   Data Gathering techniques–Interviewing

One of the most common ways of refining cost and schedule estimates is to do a three-point estimate that gives the low, most likely, and high estimate for a particular cost or duration.    Let’s take an example:    if I enter an address into my iPhone map application, it will give me an estimate for how long it will take to get there.    Right now, it’s the middle of the afternoon and it is saying that it will take 45 minutes for me to get to downtown Chicago from the southern suburb where I live.   I know that if I tried to go at 8:00 AM, it would take longer because that’s during rush hour.    It’s also possible that since the estimate is based on current traffic conditions and the conditions improve on the way to Chicago, that it might even take less time than the original estimate.    So the low estimate might be 35 minutes, with the most likely estimate being 45 minutes, and the high estimate being 1 hour 15 minutes.    In each case, I used my experience to figure out the assumptions under which these three estimates are derived.    The low estimate has to do with the assumption that traffic conditions may change for the better from what they are now,  and the high estimate is based on the assumption that I am attempting to make the same trip during rush hour.

On a project, in a similar way you ask experts through the technique of interviewing  to give a range of estimates and to list the assumptions behind them, which supports the credibility of their analysis.    If they have worked on similar projects in the past, their experience and the historical data from those projects support the reliability of their analysis.

3.   Data Representation Techniques–Probability Distributions

There are two basic types of probability distributions used when discussing risks on a project.

continuous probability distribution would be more appropriate for representing ranges of values such as cost and duration of an activity.    There are several types of continuous probability distribution, one of the most common being the “normal” distribution, what is sometimes called the “bell curve” for its characteristic shape.    However, a “triangular” or “beta” distribution which has a larger “tail” on the high end of the curve is probably going to be more appropriate for cost and duration estimates.    Just to go back to my example of driving to downtown Chicago, the probability that there will be a delay that increases my driving time is greater than the probability that the traffic will magically clear up along the stretch of road I happen to be driving along and thereby decreasing my driving time.    So the distribution of driving times will be skewed towards the high end (i.e., delays), and if I want to reduce the risk of being late to an appointment, I will have to leave earlier to account for that risk.

A discrete distribution would be more appropriate for discussing what will happen if particular events do or do not occur.   For example, what would happen if the project manager in a company building a car is requesting to make a prototype before going into mass production?    To justify the cost of building such a prototype, a decision tree could be constructed which shows that building such a prototype will reduce the cost of defects that might occur during mass production if the prototype were not done.   If the project manager can show that the savings in terms of reduced defects is greater than the cost of making the prototype, then the expense can be justified.   

Of course, it is best to find an expert that is not only experienced with the particular types of risks on the project in order to create the data on risks, but who also has experience on what type of data representation would most likely fit those data.

The next post will deal the next set of tools & techniques of quantitative risk analysis, those of modeling techniques such as sensitivity analysis, expected monetary value, and modeling simulation.   These tools take the data that was gathered in this first set of tools & techniques and does some “number crunching” to put an actual dollar figure on the amount of impact that a particular risk may have on a given project.


Integral Theory and Project Management


After doing some soul-searching in order to find a new job that would be better suited to my background, my abilities, and my temperament, I decided to go into project management.    One of the reasons why the idea of coordinating people from several functional areas of an organization to work together on a project attracted me was because of my interest in Integral Theory.   Integral Theory, which has been developed by the philosopher Ken Wilber, tries to synthesize various philosophical perspectives into an interrelated network of approaches that are mutually enriching.

I started to do a blog post on Sex, Ecology, Spirituality, Ken Wilber’s magnum opus on Integral Theory, but I soon realized it was like a graduate-level text and required a LOT of familiarity with Integral Theory in order to be able to get a lot of benefit from reading it.   I recently got the book A Brief Theory of Everything, which is Ken Wilber’s attempt to create an “undergraduate” or beginner’s introduction to the Theory.    I intend to write posts on the various chapters of the book, but I wanted to use this post to give a thumbnail description of Integral Theory for those who may be interested in pursuing it further.

1.   HOLONS

The development of philosophy which started among the Greeks had a dialectic between the One and the Many.   The tension between these two poles of philosophical thought is bridged by the concept of a holon, which is a concept introduced by Arthur Koestler and expanded upon by Ken Wilber in his twenty tenets of holons.    Simply put, every entity, concept, or even process is at once both a) an autonomous, self-reliant unit (whole entity) unto itself, and b) also a part of one (or more) other wholes, that form a set of nested “holarchies” like Russian matryoshka dolls.    These holons have horizontal relationships with other holons at the same “level”, and vertical relationships with wholes of which the holons are a part, or in the other direction, or wholes of which the holons are comprised.

2.  QUADRANTS, LINES, LEVELS, STATES, TYPES

a.   Quadrants

Each holon can be seen from its interior perspective, i.e., from the point of view of what each holon perceives of other holons, or from its exterior perspective, i.e., from the point of view of what other holons perceive of it.    Another dimension of seeing the holon is from its individual perspective, its sense as an autonomous, self-reliant unit, or from its collective perspective, its sense of connectedness to other holons on the same level.     These two dimensions of perspective, interior vs. exterior and individual vs. collective can be combined to form four quadrants:

  • interior individual or “I” perspective (intentional)
  • interior collective or “we” perspective (cultural)
  • exterior individual or “it” perspective (behavioral)
  • exterior individual or “its” perspective (social)

Different quadrants have different ways of perceiving the truth.   For example, in a trial the lawyer has to make inferences about the intentions of his or her client based on that client’s behavior.    On a project, the “truth test” or way of validating information will differ based on the type of person you are dealing with.    An engineer will want to draw a graph, an accountant will want to create a spreadsheet, and a lawyer will want logical arguments, and the marketing people will want to create a narrative.    As a project manager, you have to use skillful means in being able to communicate to any or all of these groups and tailor your message accordingly.

b.  Lines

Holons have different lines of development; these are referred to as intelligences.    Howard Gardner has pioneered the study of multiple intelligences in people,

  • musical – rhythmic
  • visual – spatial
  • verbal – linguistic
  • logical – mathematical
  • bodily – kinesthetic
  • interpersonal – emotional

There has been an increasing recognition that interpersonal or emotional intelligence is important in the workplace, in addition to the verbal – linguistic and logical – mathematical intelligences that our educational system emphasize.   The important thing to note is that just because you are highly developed in one intelligence, does not mean you that you will be highly developed in the other intelligences.    This is one of the reasons why creating diversity on your project team is important, because in that way you will likely “cover all the bases” when it comes to the various intelligences you will need to draw upon to successfully complete the project.

c.   Levels

Each of the lines of development has several levels, and people normally develop from one level to another sequentially.   In general, the lines of development can be summarized as having three broad levels:

  • egocentric (one’s concern is focused primarily on one’s self)
  • ethnocentric or sociocentric (one’s concern is primarily with one’s ethnic group or with one’s nation)
  • worldcentric (one’s concern covers the entire world)

The point here is that one can be at different levels in different lines of development.   You can read the paper every day to see news of the world, and thus have a cognitive line of development at the worldcentric level, while your emotional line of development is at the egocentric level.

d.  States

A holon’s consciousness can have several stages of development in the long term, but in the short term, there are variations called states of consciousness.    Every once awhile you can have a glimpse of a higher stage in what is called a peak experience, but this is usually just a glimpse.    To enter that stage permanently takes work!

e.  Types

Certain holons have a different consciousness than others because they are of different types, the most common pattern being male vs. female.    Understanding the interactions of the different types of holons is extremely important.

3.   SPIRITUALITY–Ascending vs. Descending

Dealing with spirituality is difficult because, for example, if you say the word “God”, it will have different meanings for different people.    These meanings are shaped by a person’s brain, experience, society and culture, to cover the four quadrants mentioned above.    In general, one line of spiritual inquiry sees “God” as separate from the world, and thus the goal is try to transcend the world and reach “God”–this is the “ascending” current of spirituality.

The other line of spiritual inquiry sees “God” as part of the world, and thus the goal is try to investigate God by investigating the various phenomena that exist in the world–this is the “descending” current of spirituality.

These two lines of spiritual inquiry not only exist in different places (the Western religions belong to the ascending current, and the Eastern religions to the descending current), but at different times in history (premodern belongs to the ascending current, modern belongs to the descending current, and postmodern belongs to both).    Understanding the language of these two currents helps in interfaith dialogue, something which I consider vital in our “global village.”

These are the main outlines of integral theory, and I intend to write summaries of some of the details of the theory as they occur in the book Brief History of Everything.   All of this may seem technical, arcane, or irrelevant to the practicalities of everyday life by some people, but I beg to differ:   the understanding of various perspectives of reality, and their interaction, is a vital philosophical training towards being able to combine the various perspectives of the people on a project team, which in turn is necessary for a project manager to do in order to get them working not as autonomous, self-reliant units but rather as a part of a whole, namely, the project.


Rosetta Stone revisited–5 changes to the Totale language-learning program


In the past two years, I have purchased many of the language-learning software packages from Rosetta Stone, including the following languages:

  • Spanish, Level 4
  • French, Level 4
  • German, Level 4
  • Portuguese, Level 1-3
  • Arabic, Level 1-3

I completed the Spanish, French, and German, and then worked on the first level of Portuguese and Arabic.    Then in addition to my job search and Toastmaster club activities, I got busy with volunteer work for busy the Project Management Institute last fall.    However, I still was able to continue with my Rosetta Stone studies.   In fact, they made a nice mental break from all of the other things I had to do.   But this spring,  when I moved to Chicago after living in Los Angeles for a decade in order to help my father who was dealing with some health issues, I found myself temporarily overwhelmed and had to curtail my Rosetta Stone online subscription.

Now that my father’s health condition has (fortunately) stabilized, I have decided to go back to Rosetta Stone and I wanted to mention some of the changes in the program for those who may be interested in purchasing Rosetta Stone.

1.   Rosetta Course–Downloaded Course

The “main menu” in the Rosetta Stone Totale language-learning program is the course itself.    Many of the most popular languages that Rosetta Stone offers such as Spanish have five levels, which take you from the beginner level at level 1, to becoming fluent in the language by level 5.    Some languages such as Arabic only have levels 1 through 3, which take you from beginning to intermediate level by the time you complete.

What is different now is that you can order just the Rosetta Course alone.    This allows you to learn the language, including Rosetta Studio, which allows you to practice what you’ve learned with a native speaker.     This feature alone in my opinion makes the investment in Rosetta Stone worthwhile.    Self-study of a foreign language is possible, but you can only gain confidence if you are able to speak with an actual native speaker and make yourself understood.

2.  Rosetta Course–Online Course

The advent of smartphones, tablet devices, etc., has made accessing the online course even more convenient than before.   In parts of Europe, Rosetta Stone is no longer sold in the familiar package with CDs–it’s downloaded via the internet.    And now Rosetta Stone in the US is offering a totally online version that doesn’t even require that you download the course like you had to before.    This gives you on a subscription basis access to the entire course on a six-month or 12-month basis.   This is probably the wave of the future for Rosetta Stone to sell its programs solely on an online-access basis rather than downloading to one’s computer.

I have an iPhone and have access to the review for each lesson through Rosetta Stone; if I had a tablet device, I could access the main content of each lesson as well.    In addition, the audio portion of the program is available for listening through iTunes, which I do when I go for walks.   (I could use it while driving, but I make it a personal point not to in order to pay attention to the road.)   These features are just an added dimension to Rosetta Stone’s online course.

3.   Rosetta Studio–session length

Speaking of Rosetta Studio, it appears that they have changed the previous live 60-minute session with a 30-minute session.   This was probably done in order to make it less intimidating for those who are first trying out their new language.    I have yet to schedule a session, so I can’t say how it differs in content that before, but I intend to try it in the next week or so.

4.   Rosetta Studio–number of sessions

In the past, you could schedule an unlimited number of sessions in a month, but now it seems they have limited the number to 4 sessions you can schedule in a month.    I think this is realistic, and here’s why.    The Rosetta Stone course as I mentioned consists of 5 levels.    Each level of competency consists of 4 units, and each unit consists of 4 lessons, after which there is a review called a Milestone for that unit.    I calculated the amount of time it takes to do all the activities in a unit, and it comes out to about two weeks to complete a unit with four lessons, if you work about 30 minutes a day.    That means in a week you can finish two lessons out of that unit, and Rosetta Studio now allows you to take a session after only two lessons rather than having to complete the entire unit as before.    So if you have a modest time commitment to Rosetta Stone on a daily basis, you will be able to have 4 sessions per month, which means the completion of two units.     This pace, if continued on, would allow you to complete an entire level in two months, or the entire suite of five levels in less than a year!

5.  Rosetta World–learning through play

I think one of the most innovative features of Rosetta Stone’s Totale program isn’t the Studio–that’s like the meat and potatoes of the program.   The dessert portion of the Rosetta Course, in my opinion, is the Rosetta World, which allows you to play interactive games by yourself or with another partner, to read stories in the target language, or to even chat with someone who may be learning your language, thereby meeting somewhere in the linguistic middle between the two languages.    This seems to be easier to navigate and use, and the number of stories available to be read by the learner has also seemed to have been rounded out.

So Rosetta Stone has evolved in the half year I have been away, due to the changes in technology, and by listening to feedback from many users on what features they were using, but sometimes what features they weren’t using and why they weren’t using them.    This is the essence of quality improvement, when you find out the needs of customers and translate them into the technical features of the product that meets those needs.

I have started by reviewing the first level of Arabic this summer, so that by the time fall comes, I can start on Level 2.   I must say that it’s nice to be back studying with Rosetta Stone, although it is certainly not the only language-learning tool I use.   I have used Michel Thomas, Pimsleur, Duolingo, and the courses at the Foreign Service Institute website (fsi.org), not to mention audio magazines such as the ones offered by Plango (Champs Elysees for French, Schau ins Land for German, and Puerta del Sol for Spanish), and the now discontinued Nihongo Journal for Japanese.   And no serious language learner would be remiss without mentioning the polyglot powerhouse that is Benny Lewis, the author of the website Fluent in 3 Months!

But although all of these programs have had something to say for them, I must say that Rosetta Stone is still one of my favorites for its philosophy of learning a new language by total immersion, rather than as an academic subject the way most of us have experienced the learning of a language.    Other language learning programs like Living Language by Transparent Language are copying Rosetta Stone’s formula by offering a chance to speak with native speakers as part of their program!   If you think about it, just like the old airline slogan used to say, “it’s the only way to fly!”


5th Edition PMBOK® Guide—Chapter 11: Process 11.4 Perform Quantitative Risk Analysis


1.  Introduction

The five risk-related project management processes in the Planning Process Group deal with setting up the Risk Management Plan (process 11.1), identifying (process 11.2), analyzing (processes 11.3 and 11.4), and then developing responses for risks to the project (process 11.5).

This post is devoted to the Inputs, Tools & Techniques, and the Outputs of the fourth of  these five processes, 11.4 Perform Qualitative Risk Analysis.

2.  Inputs

The main inputs comes from the risk management plan, the framework set up as part of process 11.1 for all risk management activities on the project, the cost and schedule management plan, which contain guidelines on establishing and managing risk reserves, and the risk register.

In particular, the Risk Management Plan should contain the guidelines, methods and tools the organization will use during the process of quantitative risk analysis.  The risk register contains not only the risks at this point, but the impact, probability, and urgency of each of those risks, which together create the risk ranking.  Once the risks are ranked in the qualitative risk analysis, this next process takes the analysis to a whole new level by quantifying the impact of each risk in terms of its effect on the cost and schedule of the project.

Finally, information from industry sources or from the organization itself on risks involved in similar projects may also be useful for this process.


11.4  PERFORM QUANTITATIVE RISK ANALYSIS
INPUTS
1. Risk Management Plan The key elements of the Risk Management Plan used in this process are the guidelines, methods and tools to be used in quantitative risk analysis.

These elements are normally developed during process 11.1 Plan Risk Management.

2. Cost Management Plan This contains guidelines on establishing and managing risk reserves.
3. Schedule Management Plan This contains guidelines on establishing and managing risk reserves.
4. Risk Register This contains the impact, probability, urgency of all risks, which together combine to give the risk ranking of each risk.
5. EEFs
  • Industry studies of similar projects by risk specialists
  • Risk databases from industry or proprietary sources
6. OPAs
  • Historical information from similar projects
TOOLS & TECHNIQUES
1. Data gathering and representation techniques
  • Interviewing
  • Probability distributions
2. Quantitative risk analysis and modeling techniques
  • Sensitivity analysis
  • Expected monetary value (EMV) analysis
  • Modeling and simulation
3. Expert judgment Expert judgment is often used to determine the potential impacts of various risks on the cost and schedule,
OUTPUTS
1. Project Documents Updates Risk register–n addition to the list of risks created in process 11.2 and their risk ranking done in process 11.3, the following information is added:

  • Probabilistic analysis of the project
  • Probability of achieving time and cost objectives
  • Prioritized list of quantified risks
  • Trends in quantitative risk analysis

The above information may be included as a separate Quantitative Risk Analysis Report.


3.  Tools & Techniques

For data gathering and representation techniques, interviewing is the main form of data gathering, specifically with regard to quantifying both the probability and the impact of the risk.   When this data is gathered , it is analyzed by use of representation techniques such as probability distributions that are tailored to the type of data being presented.

The main number-crunching in this process comes with quantitative risk analysis and modeling techniques, the first of which is sensitivity analysis.  This means determining which risks have the most potential impact on the project.  If there are risks which may occur at various points in the project, expected monetary value or EMV analysis can analyze what the impact on the project would be if certain scenarios do or do not happen.

As opposed to these uncertainties that are analyzed on a “retail” level, the large-scale or “wholesale” level of analyzing uncertainties is done through modeling and simulation, the most common example of which the Monte Carlo technique, which simulates various combinations of events that may or may not occur during the course of the entire project.  The aim is to estimate the impact of the risks of a project on its overall cost and schedule.

Expert judgment is not a tool, of course, but a technique for deciding not only which tool to use, but what the inherent strengths and weaknesses are of these tools, and therefore which might best be applied to the specific project at hand.

4.  Outputs

As with all of the risk management planning processes, the risk register is a place where the risks identified in process 11.2 will have more and more information attached to them in the course of processes 11.3-11.5.  In the case of this process 11.4, Perform Quantitative Risk Analysis, the following results are added to the risk register.

a., b.  Probabilistic analysis of the project, probability of achieving cost and time objectives

Rather than saying the project will be done for such-and-such cost by such-and-such a date, this most nuanced analysis shows that the project will be done for a certain amount of money and will take a certain amount of time within a certain confidence level.  For example, you can say that the project has a 90% probability of being be done for up to $1M and within six months.

c.  Prioritized list of quantified risks

Now the risk ranking created as an output of process 11.3 is amended to include the quantified impact of each of these risks.

d.  Trends in quantitative risk analysis results

Are there any patterns that show up repeatedly in the quantitative analysis of risks on the project?  If so, these may be added to the “lessons learned”, so they eventually become part of the “historical information” for similar projects that may be done in the future.

The posts next week will go into some detail regarding the tools & techniques of this process of Performing Quantitative Risk Analysis.

5th Edition PMBOK® Guide—Chapter 11: Process 11.3 Perform Qualitative Risk Analysis


1.  Introduction

The five risk-related project management processes in the Planning Process Group deal with setting up the Risk Management Plan (process 11.1), identifying (process 11.2), analyzing (processes 11.3 and 11.4), and then developing responses for risks to the project (process 11.5).

This post is devoted to the Inputs, Tools & Techniques, and the Outputs of the third of  these five processes, 11.3 Perform Qualitative Risk Analysis.

2.  Inputs

The main inputs comes from the risk management plan, the framework set up as part of process 11.1 for all risk management activities on the project, and the risk register, which contains the output of the last process.  At this stage, the risk register contains a list of the identified risks and possibly some potential risk responses (although these will be fully developed in the last planning process for risk management, process 11.5 Plan Risk Responses).

An analysis of the scope baseline may show in general whether the project is high risk compared to other projects by analyzing the level of technology involved and the level of complexity of the project.

Finally, information from industry sources or from the organization itself on risks involved in similar projects may also be useful for this process.

11.3  PERFORM QUALITATIVE RISK ANALYSIS
INPUTS
1. Risk Management Plan The key elements of the Risk Management Plan used in this process are

  • roles and responsibilities for conducting risk management
  • budget, schedule for risk management activities
  • definition of risk categories
  • definition of risk probability and impact
  • probability and impact matrix
  • stakeholder’s risk tolerances

These elements are normally developed during process 11.1 Plan Risk Management.

2. Scope Baseline An analysis of the scope baseline will indicate if the project has higher risk, which will occur if the project involves

  • state-of-the-art technology
  • high complexity
3. Risk Register This contains the risks and potential risk responses identified in process 11.2 Identify Risks.
4. EEFs
  • Industry studies of similar projects by risk specialists
  • Risk databases from industry or proprietary sources
5. OPAs
  • Historical information from similar projects
TOOLS & TECHNIQUES
1. Risk probability and impact assessment
  • Risk probability assessment investigates likelihood of each risk.
  • Risk impact assessment investigates potential effect on project constraints (schedule, cost, quality, scope)
2. Probability and impact matrix Based on the risk probability and impact assessment, a matrix is created showing both the probability and the impact for each risk.  A risk rating is assigned of high, moderate, or low depending on the pre-determined preference of the organization.


Sometimes, the low risks are put in a watch list for further monitoring during the course of the project.

3. Risk data quality assessment The degree to which data about risks on the project has

  • Accuracy
  • Quality
  • Reliability
  • Integrity
4. Risk categorization Risks to the project can be categorized according to their source (using the Risk Breakdown Structure), the area of the project effected (using the Work Breakdown Structure), or the phase of the project effected.
5. Risk urgency assessment Based on whether the risk is likely to occur in the near-term.  Some risk rankings combine the risk probability, risk impact, AND the risk urgency.
6. Expert judgment Expert judgment is often used to determine the risk probability and impact.
OUTPUTS
1. Project Documents Updates Risk register—for each risk identified in process 11.2, the following information is added as an output to process 11.3:

  • Assessments of probability and impact
  • Risk urgency
  • Risk ranking
  • Risk categorization
  • Watch list for low probability risks

Assumptions log–the project scope statement may contain assumptions about the project which may be updated as a result of the qualitative risk analysis done in this process.

3.  Tools & Techniques

The main tool is taking each risk identified in the last process and assessing the risk probability, the risk impact, and for some organizations, the risk urgency.  These two or three factors are then combined in a matrix, the risk probability and impact matrix, which will the risk rating for each risk.  This risk rating is taken from the product of the probability, the impact, and possibly the urgency of the project.  Usually, these three factors are measured on a scale from 0 to 1.0 or from 0 to 10.   The purpose of this ranking of the risks is so that they can be grouped as a low, moderate, or high-level risk.    The purpose of this grouping is to figure out the general approach to the risks:  will they be avoided, mitigated, transferred, or accepted in the case of negative risks (threats), or will they be exploited, enhanced, shared, or accepted in the case of positive risks (opportunities)?

For example, in some organizations, the low-level risks are simply accepted for the time being, but put on a watch list for further monitoring during the course of the project to see if their status changes either in terms of probability of occurrence or potential impact on the project.

What have been described above are tools of qualitative risk analysis, but the most often used technique is that of expert judgment, where those with expertise in risk management are consulted to come up with the initial assessments of the risk probability and impact.

4.  Outputs

As with all of the risk management planning processes, the risk register is a place where the risks identified in process 11.2 will have more and more information attached to them in the course of processes 11.3-11.5.  In the case of this process 11.3, Perform Qualitative Risk Analysis, the risk categorization (what is the source of the risk, what activities on the project is it most associated with, etc.), and the risk probability, impact, and urgency, and then their combination in the risk probability and impact matrix, are the important additions to the risk register.

The next process is taking the qualitative risk analysis of the risks done in this process and taking it to the next step, to performing a quantitative analysis of the risks.  That is the subject of the next post.

Folk Tales, Game Theory and the Civil Rights Movement


This is the text of a speech I am going to give at my next Toastmasters club meeting for the advanced speech manual called Storytelling. It is based on the book Jane Austen and Game Theory by Michael Chwe.

1. Introduction
The civil rights movement in the 1960s was able to prevail and produce the Civil Rights Act of 1964 due in large part to the moral authority of Dr. Martin Luther King, Jr. But the success was also due to some very shrewd strategic thinking about targets to choose for his campaign of non-violent protest.

This legacy of strategic thinking was informed by a source that at first glance might not seem to have anything to do with strategy, and that was the folk tales told by African-American slaves and passed on through generations. Michael Chwe, in his book Jane Austen and Game Theory, argues that both written literature, in the form of the novels of Jane Austen, and the oral tradition, in the form of African-American folk tales, demonstrate a keen understanding of strategic thinking.

2. Game Theory
The science of strategic thinking is called game theory, and it has been developed in the latter half of the 20th century with the tools of mathematics. Think of a game of chess. If you make a move here, then that will influence my decision about where to do my next move. In turn, my next move will influence your decision about where to do your next move. You are I are strategic actors, meaning that we have a choice of certain actions, and we try to develop a strategy that will maximize our benefit, at the same that you are trying to maximize yours. Any kind of interaction, competition or struggle can be put into the framework of strategic decision making or game theory.

It turns out that if a strategic actors understands how the other side thinks, and can predict what that person will do, then that strategic actor has an advantage. However, if the strategic actor does not understand how the other side thinks, or to put it a different way, is clueless, then that strategic actor has a disadvantage. Here’s the key point: If there is a difference in power between one actor and another, the one who is relatively powerless but understands strategic thinking may be able to gain an advantage over the more powerful one if that person is clueless.

Let me tell you a story to illustrate my point called Flossie and the Fox.

3. Flossie and the Fox
Flossie was told by her mother to take a basket of eggs to her grandmother, but to watch out for the fox, who LOVES eggs. But Flossie had never seen a fox before, so she didn’t know what to look out for. Flossie skipped along and she encountered a strange creature who said, “I am a fox, and I want those eggs.”

“I purely don’t believe it … how do I KNOW you’re a fox? Maybe you’re some another animal who’s just saying that so I’ll be scared and give you these eggs. Good day, whatever you are …” and off she went.

“Whatever do they teach children these days? “ said the fox. The fox says, “I’ll prove to you that I’m a fox, then. Look at this thick fur!” Flossie said, “that just means you could be a rabbit—they got’s thick fur!” She went on.

“Okay, I’ve got another proof. I’m a fox—because I’ve got this long pointed nose.” Flossie said, “a rat’s gotta long pointed nose, too. You could be one of them … I ain’t given no eggs to no rat.” She walked further.

“Well, how about my bushy tail, then? How do you explain that?” Fox was satisfied that her had the girl cornered with his logic. “You could be a squirrel, they got bushy tails.”

The fox kept following her, thinking of how he could finally prove to the girl that he was a fox so she would give him some eggs. A cat was running hurried from the other direction, and the fox said, “hey, cat! I need some help here!” The cat looked at the fox chasing after the girl and wondered why the FOX needed help. “This girl doesn’t believe I’m a fox—she doesn’t believe anything I say. You’re a third party, you tell her what I am.”

“Oh, he’s a fox, all right!” Flossie now turned to the cat. “well, how do YOU know that he’s a fox?” “Well, he’s got sharp claws and yellow eyes.” “Well, so do YOU. That just shows that he could be a cat!” The cat said, “hey, there’s a hound coming this way, so I don’t have time to argue—goodbye!”

A hound? Well, it was the hound belonging to Flossie’s grandmother, who smelled the fox and was coming this way to chase him off. As the fox dashed away, he yelled, “well at least the HOUND has a lick of sense. He knows what I am! I’m a fox!”

And Flossie said, “I know.” And she walked unhindered all the way of the way to her grandmother’s house.

THE END

4. Game Theory in Story
How does this folk tale reflect strategic thinking? If it were a contest of power, the fox could have overpowered Flossie easily. But rather than focusing on the eggs, she changed the framework and made the contest about the fox’s own identify. She instinctively knew that because he was powerful, he would have a powerful ego, and would do anything to defend it. So she distracted him, and made him play a new game by her rules, and by outfoxing the fox, bought herself just enough time to get to her destination safely.

You may consider this a tale of amusement and entertainment, but the strategic thinking buried in this story and many others like it was a legacy that the African-Americans who told them passed on to future generations so that they could use it when it was needed.

5. Game Theory and the Civil Rights Movement
And in the 1960s, that legacy informed the planners of the civil rights movement, including Dr. Martin Luther King. In 1962, they had tried to mobilize the community in Albany, Georgia, but the chief of police had read Dr. King’s speeches and had researched his tactics and directed his police to use “no violence, no dogs, no show of force” and because he knew of King’s strategies, was able to neutralize them and avoid a confrontation. In January 1963, the activists in the Southern Christian Leadership Council developed a tactical plan to desegregate Birmingham, Alabama. Why did they choose that place as a target? Because of the public safety commissioner, “Bull” Connor, who was the prototypical figure of a white racist law enforcement officer. He was willing to use violent tactics, including police dogs and fire hoses on demonstrators even if they included women and children.

This not only accelerated and built up the momentum of the movement in the South, but gained Dr. King new allies throughout the country as the violence was shown on television in living rooms all across the nation. They chose “Bull” Connor because he was bull-headed, and therefore clueless, acting in such a way that would win his battle, but ultimate help lose the war against civil rights, when the Civil Rights Act was finally passed the following year.

And in the legacy of African-American folk tales, we find today, when Civil Rights again are under attack, a powerful message, that we can use the power of language to confront the language of power and, God willing, prove Dr. King correct who said that “the arc of the moral universe is long, but it bends towards justice.”