

In the next week, I would like to discuss the 7 management tools that are used in conjunction with the DMAIC methodology in the course of managing a Six Sigma project. The first is that of affinity diagrams. I am indebted to the Project Management Hut (http://www.pmhut.com) for their lucid explanation.
1. What is an affinity diagram?
It is a brainstorming tool, developed by Jiro Kawakita in the 1960s, which is why it is sometimes referred to as the “KJ Method” (in Japanese, last names are listed first).
It is a way of taking a series of facts, ideas, or data on a certain general theme and organizing it into groups of clusters. It can be the first step towards a cause-and-effect analysis using an Ishikawa or fishbone diagram.
2. How does it work?
You get the various stakeholders who are involved on a problem to get together. You buy a lot of variously colored post-it notes or 3×5 cards which are the “atoms” of facts or ideas that you are going to assemble into the various groupings.
Here’s the steps you take:
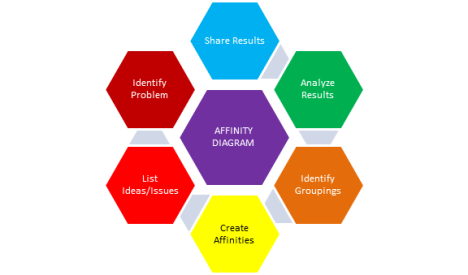
| Step | Description | |
| 1. | Identify Problem | Define your problem or identify a general theme. Example: why has customer satisfaction rate been declining? |
| 2. | List ideas/issues | List the relevant facts, data, ideas, opinions regarding the subject and put these on the post-in notes or index cards. Post these on a noteboard or blackboard. |
| 3. | Create affinities | Notice which of these notes or cards are similar and arrange them according to patterns based on those affinities. |
| 4. | Identify Groupings | Label each group of similar notes or cards with a label for each Affinity group. These could be aspects of the problem under consideration. Prioritize these problems that have been identified. |
| 5. | Analyze Results | Look at the overall groupings created and the facts/ideas associated with each. What insights does this create with regards to the problem stated at the beginning? Does it suggest potential solutions? |
| 6. | Share Results | Share the results with the stakeholders at large. |
For an example of how this would work with a real-world problem, please go to the following website because I thought they did a great job showing the various steps I outlined above.
http://www.mindtools.com/pages/article/newTMC_86.htm
In conclusion, the affinity diagram or KJ method is a way of synthesizing data and allowing natural patterns to emerge, which allow you to approach the problem in a more organized and systematic way in order to create a more comprehensive solution.
Filed under: Uncategorized |

[…] https://4squareviews.com/2012/12/06/six-sigma-green-belt-management-tool-1-affinity-diagrams/ […]