Six Sigma Green Belt: Team Tool #2—Nominal Group Technique


This technique is similar to multivoting in its purpose, but the method is slightly different.

You first create a list of ideas (blue), then you vote on them (green), and then you take the final results, announce them and discuss them (red).

Step Explanation
1. Discuss Explain the purpose of the activity, to generate a list of action items by means of group consensus.


2. Write down Each person should write down their ideas separately; collect them.


3. Clarify Put all ideas on whiteboard.


4. Cull List Combine similar items so you have a final list of ideas.


5. Distribute Cards Distribute index cards so that there is one index card for every 5 or so ideas on the final list.
6. Vote Vote for the best ideas, one idea per index cards.


7. Rank Rank how many votes each idea receives, rank in order from most chosen to least chosen.
8. Announce Announce the top-ranked ideas.


9. Discuss Agree upon moving forward on the action items that were top-ranked by the group.

The difference here between this and the multivoting technique is that the generation of ideas is done separately by members, and the results are pooled together. This can also be done by sending responses remotely to, say, subject matter experts (SMEs) or stakeholders, for example.

The purpose, however, is the same, to generate ideas on what problems to handle next and to develop a group consensus on which of them have highest priority, so there is buy-in from the group going forward. Even if your pet project wasn’t voted on, you can at least have the satisfaction that your idea had an airing before the group.

Advertisement

Six Sigma Green Belt—Team Tool #1: Multivoting


We’re coming to the end of the material in the Green Belt Body of Knowledge under the Define portion of the DMAIC (Define-Measure-Analyze-Improve-Control) methodology of Six Sigma.  This series of posts covers various brainstorming tools used  by teams such as multivoting, nominal group technique, and force field analysis.

Here are the steps of multivoting. You first create a list of ideas (blue), then you vote on them in a series of rounds (green), and then you take the final results, announce them and discuss them (red).

1. Brainstorm Generate a list of items to be considered using a brainstorming technique. Record the items on a whiteboard, flipchart, or other surface so members can see it.


2. Review & Combine Review each item so group understands it. If there are any items that are similar, combine them if group agrees.


3. Number Once items have been combined, number them in a list for voting purposes.
4. Decide Vote Method Group decides on voting method. Typically, each person gets to vote for 1/3 of the total number of items in list.


5. Conduct Vote Each person votes for items he or she considers most important in list.


6. Tally Vote Tally the amount of votes and list items in terms of number of votes cast.


7. Reduce Items Select items based on voting criteria. Some groups only choose those items voted on by at least half of the participants. Some groups eliminate the three least-voted items.
Redo steps 5, 6, and 7 with continuously shrinking list of items until only four or five items remain.
8. Announce Results Announce final four or five ideas that remain after multivoting process complete.


9. Discuss Results Discuss final list of items. Conduct a group discussion to decide which of the final ideas should receive top priority. Or conduct one last round of votes to see which item is the priority item.

The purpose of this team approach is to achieve a consensus of which items have a priority based on the opinions of those on the team.

Six Sigma Green Belt—Define: Team Dynamics and Hofstede’s Cultural Dimensions


In the last post I discussed many of the issues that can impede the development of group dynamics. The last type of issue I listed was that of cultural issues. I wanted to go further into this topic in this post using the cultural dimensions developed by Geert Hofstede.

His theory is that different countries have different cultures or value-systems that be compared by looking at several dimensions along which these cultures can be said to reside. He started out with four different dimensions, and the theory has gradually grown to six of them.

Let’s take a look at each of these dimensions in turn.

Cultural Dimension

Definition and Contrasting Pairs

1. Power Distance Index (PDI) The extent to which less powerful members of organizations accept that power is distributed unequally.

High power distance countries are more autocratic, low power distance countries are more democratic.

2. Individualism (IDV) The degree to which individuals are integrated into groups.

Individualistic societies stress personal achievements, individual rights. Collectivist societies stress group affiliations and loyalty

3. Uncertainty Avoidance Index (UAI) The degree of tolerance for uncertainty and ambiguity.

High uncertainty avoidance cultures are more emotional, and control changes with rules, laws and regulations. Low uncertainty avoidance cultures are more pragmatic, and have as few rules as possible.

4. Masculinity vs. Femininity (MAS) The distribution of emotional roles between genders.

Masculine cultures are competitive, assertive, materialistic; feminine cultures place more value on relationships and quality of life issues.

5. Long term orientation (LTO) The time horizon of a society.

Long term oriented societies are oriented to the future, and are pragmatic, rewarding persistence and saving.  Short term oriented socieites are oriented to the present and the past, and are steady, rewarding reciprocity in social relations and the fulfilling of social obligations.

6. Indulgence vs. Restraint (IND) The ability to show one’s inner feelings.

Indulgent societies are those that allow the expression of one’s inner feelings to others, whereas societies that are restrained discourage this kind of expression.

For these six cultural dimensions, here are some examples of countries or regions that have high, medium, or low values in each dimension. In the case of countries, their scores are given on a ranking scale from 1 (lowest) to 120 (highest).

High

Medium

Low

PDI Latin American, Asian, African, Arab countries; Southern and Eastern Europe United States Northern Europe
IDV North America, Europe Japan, Arab countries Asia, Africa, Latin America
UAI Latin American, Germanic countries, Southern and Eastern Europe, Japan Latin America (varies from country to country) Anglo, Nordic countries, China
MAS Japan, Germanic countries Nordic countries
LTO East Asia Eastern and Western Europe Anglo countries, Arab countries, Africa, Latin America
IND Latin America, Africa, Anglo and Nordic Europe East Asia, Eastern Europe, Arab world

Knowing the difference between cultures can be the first step in avoiding cultural miscues between team members from those cultures, and eventually developing cross-cultural leadership.

Six Sigma Green Belt: Define—Team Building Challenges


In the previous post I discussed the process of team development, according to the stages set forth by the American psychologist Bruce Tuckman. Those are the stages that develop if everything develops  well. What are the some of the challenges that can occur that could prevent arrest the development of a team?

These problems range from psychological differences (red), organization issues (blue), ego conflicts (green), and cultural differences (purple).

Problem Explanation Possible solution
1. Dominant or reluctant members Some people have a fear of stating their opinion in front of others, where others seem to have a fear of NOT stating their opinion and tend to dominate the discussion. Give the floor to the shy people FIRST. Have time limits on comments from dominant members or have them keep the minutes of the meeting which will force them to listen to others. 
2. Group think In many cultures, there is a pressure to conform to the group or to the manager’s opinion; differing opinions are not expressed. Have the younger or more junior people speak first or have separate meetings of the junior people who represent their findings to the senior staff. 
3. Anarchy The opposite extreme from group think is when any member of a meeting is allowed to go off on a tangent. Have an agenda prepared and a timetable and stick to it; table discussions that are off topic or that go on too long. 
4. Lack of trust Teams meet only at virtual meetings, so trust is slow to develop. Have at least one face-to-face meeting at the beginning of team project; find some way of having team members access biographical information on other members so they are seen as human beings beyond the professional role they play. 
5. Stating opinion as fact If you give you opinion about a person’s idea and state it is as a fact, rather than how you see it from your perspective, then it makes it harder for them to accept. You should teach people how to do evaluations that MUST be prefaced b words such as “in my opinion,” “I think”, etc., to let people know that it is your opinion–and nothing more.


6. Put-downs Criticism that is focused on the person and not on the idea. Criticizing an idea without giving any indication of how to improve it. Make clear rules about attacks on a person rather than their ideas. All criticism must be constructive. If you don’t like the idea, say how you yourself would improve it. 
7. Humor In the early stages of team formation, humor can backfire if it is not understood or worse, misunderstood. This can occur because people from different cultures may interpret something said or even a gesture differently. Avoid making jokes and alleviate tension in a way that is less risky, until you get to know participants better. Cultural awareness on the part of the project manager is essential.

These above are examples of the different sources of conflict that might occur. However, the last one, that of cultural differences, is an increasingly important topic in teams that are international or global. So the next post deals in more detail with these cultural differences.

Six Sigma Green Belt—Define: Stages of Team Development


Another important topic in the Define phase of DMAIC (Define-Measure-Analyze-Improve-Control) in Six Sigma is that of team dynamics and performance. One of the subtopics to be addressed in this topic is that of how teams develop in the first place.

The American psychologist Bruce Tuckman did research in the theory of group dynamics, and in 1965 came up with his 4 stages of group or team development, to which he added a fifth stage in 1977.

The following is a chart which sums up these stages. Notice that the role of the manager changes with each stage, from a relatively “hands on” approach at first to a more supervisory role, and finally to someone who recognizes achievement of the team and of individuals.

Stage Description Role of Manager
1. Forming Team meets, agrees on general goals. Members still conceive of themselves as individuals. Direct work
2. Storming Different members put forward ideas that compete for adoption by the group. Members start opening up to other members’ perspectives. Tolerance and patience must be emphasized to resolve differences. Conflict resolution
3. Norming Mutual plan is agreed upon by the team. Members sacrifice some of their ideas to make the team function. Team members start to identify with group and have ambition to work together for success of the team’s goals. Facilitate decisions
4. Performing Team members now identify as a well-functioning unit. Mentor and coach
5. Adjourning/

Transforming

Team breaks up. Achievements are recognized. Lessons are learned for the next project. Reward/ recognize achievement

The Adjourning/Transforming stage was the one that Tuckman created in 1977. The importance of this for project management is that it is where a review of the project both in its positive aspects (rewarding) and negative aspects (lessons learned for future projects) takes place.

These stages are not what every team goes through; they represent the potential stages of growth. . It is certainly possible that a team may stay in the stage of Storming (stage 2) during the entire project. The group may start coming together in the Norming stage, but never achieve that focused intensity as a group marked by the Performing Stage. Since all projects have an end, the team will break up, but it is up to the manager to make sure the recognition of achievement and review of lessons learned takes place.

Using Different Advanced Communication Manuals in Concert in #Toastmasters


This post contains a revelation that a DTM shared with me recently about how to approach doing advanced speeches from different manuals in the Advanced Communication series.

I’ve been in Toastmasters for two years now, and this is the year that I made the transition from doing speeches in the Competent Communicator manual to doing speeches from Advanced Communication Manuals. In April of this year, I got my Competent Communicator award and was looking forward to doing speeches from two different manuals in the Advanced Communication series (there are about a dozen in all).

I am a dual club member, with one of the clubs being my “home” club and another one that is more of a professional networking club, since it consists of project managers which is what my profession is now. So I picked two manuals, The Entertaining Speaker and Speaking to Inform. I figured I would do the entertaining speeches at my home club, and the informative speeches at my professional club.

That seemed to work out well, but then at the end of the year, I had a chance to do one of the speeches from The Entertaining Speaker at my professional club.  One of the Distinguished Toastmasters (DTMs) in our club saw that speech, and then subsequently saw the last one of the informative speeches I did out of the Speaking to Inform  manual. He said that the informative speech I did was “getting boring” in comparison to the other speech I had done previously.

This may seem harsh criticism, but he explained why he said it.   He said that I needed to establish the same rapport with the audience that I did during the entertaining speeches, so that people would connect with me and then be interested in the information I was presenting. If I did that, then my informative speeches would be entertaining as well, and therefore get the message across better.

Well, it’s about a dry subject, I rationalized, and at first I just thought that his criticism may not have been justified. But the more I thought about it, I realized that he was right.

I had divided my mind artificially between the entertaining speeches I did in the one club and the informative speeches I did in the other. With the entertaining speeches I was experimenting with different styles and I was really growing in terms of my delivery of a speech. On the other hand, with the informative speeches I was concerned about whether I was getting the information across, and not necessarily how I was delivering it.

What the DTM told me meant that I needed to tear up my artificial barriers in my mind and do a speech that was at once BOTH informative and entertaining. A dry, aloof style may be fine for a professor giving a lecture, but a speech is not the same as a lecture. You can use emotion to reach out to an audience and connect with them, and then since they care about you or relate to you in some way, whatever you tell them is going to have a bigger impact.

So having finished the Advanced Communicator Bronze by finishing both these manuals, I have vowed that in 2013, I was going to go for two different manuals, but I was not going to make the same mistake. I would use them TOGETHER to make ALL of my speeches better. I needed to connect to the art of telling a story so I picked the Storytelling Manual. And because of my growing interest in leadership, I picked Speeches by Management as my other manual.  But in expanding my ability to tell a story to the audience, I can then use that ability in my other manual to inspire the team members whom I am managing.

So my message for 2013 is, don’t work on one manual at a time. Use two different manuals and alternate doing speech projects from either one of them. Then see if the lessons you learned in one manual can’t teach you a thing or two in doing the speeches for the other manual.

Sex, Ecology, Spirituality—The Concept of a Holon


Lana Wachowski is the co-director with her brother Andy of the recent movie Cloud Atlas as well as such films as The Matrix Trilogy, and V for Vendetta. I saw the movie and read a review of the movie in the New York Review of Books.* I was reminded of the fact that Ken Wilber, the philosopher who wrote A Theory of Everything, stands was her philosophical muse in the same way that Joseph Campbell was to George Lucas, who based Star Wars on the “monomyth” described in Campbell’s The Hero of A Thousand Faces. Having read Ken Wilber’s book mentioned above, I decided to go deeper into his philosophical writings by reading his magnum opus, Sex, Ecology, Spirituality (aka SES) and take some notes while I go through the book. I will do posts regarding his book from time to time as I take some “time off” from writing about my usual subjects of project management, quality control, and globalization.

(The review can be found at http://www.nybooks.com/blogs/nyrblog/2012/nov/02/ken-wilber-cloud-atlas/).

1. The Three Books of SES

Sex, Ecology, Spirituality actually is three books, two books plus the footnotes to both. The first book contains his notes on Integral Theory, which looks at experience from a series of different perspectives. The second book discusses the barriers that people face in opening up their vision to the different perspectives of Integral Theory. The third book contains the “graduate level” discussion of many of the points brought up in the first and second books.

2. First Book, Chapter 1: The Web of Life (review)

The first chapter, The Web of Life, introduced the modern ecological meme of the “Web of Life”, and how it is related to its philosophical forerunner in the Middle Ages called the Great Chain of Being.

The intellectual history of this relationship shows three main overall stages, the medieval or pre-modern synthesis of the Great Chain of Being, the break-up of that synthesis with the rise of modern science, and the new post-modern synthesis that emerged during the latter part of the 20th century called The Web of Life.

These two memes are from two different worldviews (medieval and post-modern), and yet they share the same structure of a “nest of concentric circles” which Ken Wilber referred to as a “holarchy”, to differentiate it from a linear vertical relationship (hierarchy) or linear horizontal relationship (heterarchy).

The Great Chain of Being and the Web of Life are two philosophical memes which represent a holarchy, and I believe that’s why he presented them in this first chapter before he presented the details of holons, which come in the next chapter.

3. First Book, Chapter 2: The Pattern that Connects

The second chapter, after having introduced by example what a holarchy is, he then spends the next chapter describing what he refers as to as holons. A holarchy is a series of nested holons, where each thing or process is a part of a larger whole, and so can be considered technically a part or a whole, but BOTH. This term was coined by Arthur Koesler, but you can see it’s philosophical significance as finally solving the philosophical dilemma of “the one and the many.” The universe can be seen as the sum of its parts (“the many”) or the totality or whole (“the one”). Which is the more essential or “real”?

Plato was a proponent of the “one over many” school, saying in the Republic:“We customarily hypothesize a single form in connection with each collection of many things to which we apply the same name.”
Heraclitus on the other hand thought that the world consisted of many parts, some of which were in opposition to each other, and that the opposition between these parts was what held them together as One. Democritus, with his theory of atoms, was a proponent that the parts (atoms) were the most important. So one theme running through Greek Philosophy is explaining the relationship of the One to the Many. The concept of holons, where objects or processes are both One (the whole containing smaller parts) and the Many (a part of a larger whole) bridges these two themes very well.

In the next post, I will list the 20 tenets or principles that Ken Wilber has developed for these holons regarding how they are interrelated, how they develop or evolve, and how they sometimes devolve or dissipate. This is probably the most arcane of the chapters, even according to Ken Wilber, but I think some examples will allow people to relate to the underlying principles of what he’s trying to get across.

Six Sigma Green Belt—Process Performance Metrics


A. Performance Metrics:  purpose

What are the ways you can measure how successful your Six Sigma project has been in improving quality or decreasing the number of defects?

Before we go into the metrics and definitions, let’s say what “defects” and “defective” mean. Something has a defect if the result or outcome of a process is not what is expected. Something went wrong. The product may still be usable: a car with chipped paint can still be driven.

So some engineers use “defective” to mean a product which is not usable. Oops, we forgot to put an engine in that car: well, that’s a defective car because it can’t be driven. However, for the purpose of quality control, “defective” simply means “contains a defect,” whether that defect is cosmetic or whether it actually affects the function of the part as intended. (So just be careful to make sure you are on the same page in terms of your definition as those you are communicating to).

There can be different types of defects in a single part based on different causes.

B. Performance Metrics–Definitions

Here is a list of the Performance Metrics which are spelled out and then given an acronym if one is commonly used. The description is given of what this metric means.

Performance Metric Description
1. Percentage Defective What percentage of parts contain one or more defects?
2. Parts per Million (PPM) What is the average number of defective parts per million? This is the same figure in metric 1 above of “percentage defective” multiplied by 1,000,000.
3. Defects per Unit (DPU) What is the average number of defects per unit?
4. Defects per Opportunity (DPO) What is the average number of defects per opportunity? (where opportunity = number of different ways a defect can occur in a single part
5. Defects per million Opportunities (DPMO) The same figure in metric 3 above of defects per opportunity multiplied by 1,000,000
6. Rolled throughput yield (RTY) The yield stated as a percentage of the number of parts that go through a multi-stage process without a defect.
7. Process sigma The sigma level associated with either the DPMO or PPM level found in metric 2 or 5 above.
8. Cost of poor quality The cost of defects: either internal (rework/scrap) or external (warranty/product)

C.  Performance metrics–Discussion and examples

1. Percentage Defective

This is defined as the

(Total number of defective parts)/(Total number of parts) X 100

So if there are 1,000 parts and 10 of those are defective, the percentage of defective parts is (10/1000) X 100 = 1%

2. PPM

Same as the ratio defined in metric 1, but multiplied by 1,000,000. For the example given above, 1 out of 100 parts are defective means that 10,000 out of 1,000,000 will be defective so the PPM = 10,000.

NOTE: The PPM only tells you whether or not there exists one or more defects. To get a clear picture on how many defects there are (since each unit can have multiple defects), you need to go to metrics 3, 4, and 5.

3. Defects per Unit

Here the AVERAGE number of defects per unit is calculated, which means you have to categorize the units into how many defects they have from 0, 1, 2, up to the maximum number. Take the following chart, which shows how many units out of 100 total have 0, 1, 2, etc., defects all the way to the maximum of 5.

Defects 0 1 2 3 4 5
# of Units 70 20 5 4 9 1

The average number of defects is DPU = [Sum of all (D * U)]/100 =

[(0 * 70) + (1 * 20) + (2 * 5) + (3 * 4) + (4 * 9) + (5 * 1)]/100 = 47/100 = 0.47

4. Defects per Opportunity

How many ways are there for a defect to occur in a unit? This is called a defect “opportunity”, which is akin to a “failure mode”. Let’s take the previous example in metric 3. Assume that each unit can have a defect occur in one of 6 possible ways. Then the number of opportunities for a defect in each unit is 6.

Then DPO = DPU/O = 0.47/6 = 0.078333

5. Defects per Million Opportunities

This is EXACTLY analogous to the difference between the Percentage Defective and the PPM, metrics 1 and 2, in that you get this by taking metric 4, the Defects per Opportunity, and multiplying by 1,000,000. So using the above example in metric 3:

DPMO = DPO * 1,000,000 = 0.078333 * 1,000,000 = 78,333

6. Rolled through Yield

This takes the percentage of units that pass through several subprocesses of an entire process without a defect.

The number of units without a defect is equal to the number of units that enter a process minus the number of defective units. Let the number of units that enter a process be P. The number of defective units is D. Then the first-pass yield for each subprocess or FPY is equal to (P – D)/P. One you get each FPY for each subprocess, you multiply them altogether.

If the yields of 4 subprocesses are 0.994, 0.987, 0.951 and 0.990, then the RTY = (0.994)(0.987)(0.951)(0.990) = 0.924 or 92.4%.

 7. Process Sigma

What is a Six Sigma process? It is the output of process that has a mean of 0 and standard deviation of 1, with an upper specification limit (USL) and lower specification limit (LSL) set at +3 and -3, respectively. However, there is also the matter of the 1.5-sigma shift which occurs over the long term.

The result is the following two charts, one without and one with the 1.5-sigma shift.

 This is from ASQ’s website under Quality Process. Refer to this site for more detailed information on the theory and mathematics behind this 1.5-sigma shift.

 http://asq.org/quality-progress/2009/08/34-per-million/perusing-process-performance-metrics.html

 8. Cost of poor quality

Also known as the cost of nonconformance, this takes the cost it takes to take care of defects either

a) internally, i.e., before they leave the company, through scrapping, repairing, or reworking the parts, or

b) externally, i.e., after they leave the company, through costs of warranty, returned merchandise, or product liability claims and lawsuits.

 This is obviously more difficult to calculate because the external costs can be delayed by months or even years after the products are sold. It’s best, therefore, to measure those costs which are relatively easy to calculate and quickly available, i.e., the internal costs of poor quality.

 The above are some of the metrics you can use BEFORE your Six Sigma Project and then AFTER your project to show that the countermeasures you have devised have had a positive effect. How certain can you be of this? That is the subject of the measurement section, which comes after this Define section of the Body of Knowledge is done.

Six Sigma Green Belt–Management Tool #7: Activity Network Diagrams


This is the last in the series of posts on 7 different management tools that can be used on Six Sigma projects.   This last tool of activity network diagramsi is used when you have decided on a Six Sigma Project, and you need to know how long it is going to take.  Also, you need to be in a position to be able to figure out whether you can compress the schedule to reduce the time it takes to do the project.  Finally, you need to plan on effective risk management to make sure that the project stays on schedule.

To do this, you need to create an activity network diagram. Once you create the diagram you need to figure out the critical path, which is the path from the start to the finish of the project with the longest cumulative duration. Those activities on the critical path may not be delayed without delaying the schedule as a whole. Other activities that are NOT on the critical path may be delayed for a certain period of time without affecting the schedule, and the amount of “wiggle room” in the schedule for any given activity is called the float of that activity.

First step is creating the activity network diagram.

Step Description
1. Define Activities Take the work breakdown structure or WBS, which takes the general objectives of the project and breaks them down into deliverables. Then take each deliverable and list all activities it will require to accomplish it.
2. Sequence Activities 
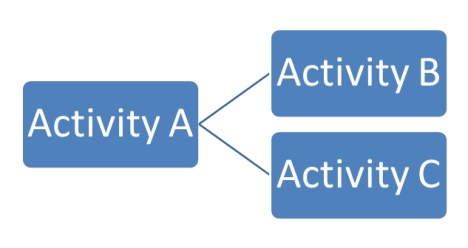
Sequence the activities based on the precedence relationship between them. Some activities have to be completed before others are started, for example. Other activities may be able to be done simultaneously. Based on these relationships between activities, create a network diagram that looks like a flowchart with a box for each activity.
3. Estimate Activity Durations Add a duration to each of the boxes containing the activities.
4. Critical Path Method Calculate the duration of the various “branches” of the network in order to determine which branch is the critical path of the network.
5. Calculate “Float” or “Slack” Using the forward pass and backward pass method, calculate the total float or slack of each of the activities. NOTE: An activity on the critical path will have ZERO float BY DEFINITION

6.5.2. Critical path method

To determine how long a project will take, you need to find out the critical path, that is, the sequence of activities in the network diagram that is the longest. Other paths along the network will yield sequences of activities that are shorter than the critical path, and they are shorter by an amount equal to the float. This means that activities that have float could be delayed by a certain amount without affecting the schedule. Activities along the critical path have a float of zero. This means that any delay along the critical path will affect the schedule.

Here’s an outline of the critical path methodology.

a. You create a network diagram of all the activities.

b. You label each activity with the duration derived from process 6.4 Estimate Activity Durations.

c. You do a forward pass to determine the early start and early finish date of all activities, from the start of the project to the end of the project.

d. Once at the end of the project, you do a backward pass to determine the late start and late finish date of all activities, from the end of the project to the start of the project.

e. For each activity, you use the results of c and d to calculate the float of each activity.

f. All activities that have 0 float are on the critical
path for that project.

Let’s take a look at the methodlogy in general.

Step 1. For each activity, create a matrix which will contain the duration, the early start, the early finish, the late start, late finish, and float for a particular activity.

Activity Number

Duration

Early Start (ES) Early Finish (EF)
Late Start (LS) Late Finish (LF)

Float

Here are the meanings of the numbers in the boxes:

Activity Number: you can label them A through Z, or 1 through N, just as long as each activity has a unique identifier.

Duration: this is the number that you should get as an output of the 6.4 Estimate Activity Durations process.

Early Start (ES): The Early Start is the number you begin the analysis with to do the forward pass. It is defined as 0 for the first activity in the project. The Early Start for subsequent activities is calculated in one of two different ways, which will be demonstrated below.

Early Finish (EF): This is the next number you go to in the forward pass analysis. It is taken by adding the number in the ES box plus the number in the Duration box.

Late Finish (LF): The Late Finish is the number you begin the analysis with to do the backward pass. It is defined to be equal to the number in the Early Finish box for the last activity in the project. The Late Finish for preceding activities is calculated in one of two different ways, which will be demonstrated below.

Late Start (LS): This is the next number you go to in the backward pass analysis. It is taken by subtracting the number in the Duration box from the number in the LF box.

Float: Once ES, ES, LF, and LS are determined, the float is calculated by either LS – ES or LF – EF. Just remember that a piece of wood will float to the top of the water, so the float is calculated by taking the bottom number and then going upward and subtracting the number that’s on the top of it.

Step 2.

For activity A, the first activity in the project, ES = 0.

A

0

Step 3.

Then EF for activity A is simply ES + duration. Let’s say activity A takes 5 days. Then EF = 0 + 5 = 5.

A

5

0

5

Step 4.

The forward pass for activity A is complete. Let’s go on to activity B.

Since activity B has only one predecessor, activity B, the ES for activity B is simply equal to the EF of activity A, which was 5.

B

3

5

Then the EF for activity B is taken by adding the ES of to the duration of activity B or 3, giving EF = 5 + 3 = 8.

There’s one more situation that we have to discuss and that is if an activity has more than one predecessor.

Let’s assume the durations for each activity are as follows:

Activity Duration
A 5
B 3
C 6

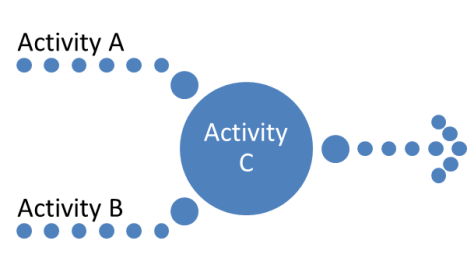
Assume Activity A and Activity B are both done concurrently at the start of the project, and both need to be done in order for Activity C to start. Well, before we do the formal forward pass analysis, what does logic tell us? Activity A takes 5 days; Activity B takes 3 days. Both activity A and B have to be done before Activity C can take place. In this case the start date of the project is considered to be 0. Can Activity C take place on day 3, when activity B is done? No, because Activity A isn’t completed yet, and you need BOTH A and B to be done. The earliest possible start date for Activity C will be day 5, because only on that date will both A and B be done.

So this illustrates the other way of calculating ES for an activity B. If there are multiple predecessors, then the ES is equal to the LARGEST of the ES of the predecessor activities.

Step 5.

Now, let’s assume we are at the end of the project at activity Z.

Z

5

95

100

EL = ES + duration gives us EL = 95 + 5 + 100. So the project will take 100 days according to our forward pass calculation.

Now, we have the backward pass.

We start this out by stating as a principle that the late finish or LF date for the last activity in the project is equal to the EF date.

Z

5

95

100

100

Then, of course, the late start date or LS = LF – duration = 100 – 5 = 95.

Z

5

95

100

95

100

Step 6.

Now we go in the reverse direction towards the beginning of the network diagram, this time filling out the bottom LS and LF boxes for each activity.

If the activity has one successor, then the LF for the predecessor activity equals the LS for the successor of activity. But if there are more than one predecessor activity, then here’s what you do. For the forward pass, you take the highest EF of all predecessors.

For the backward pass, you take the lowest LS of all successors. Let’s see how this works.

Let’s assume the forward pass is done on A, B, and C. We do the backward analysis and we get to the following point. What is the LF of activity A?

A

B

C

5

3

4

0

5

5

8

5

9

6

9

5

9

Well, activity B and activity C are both successors of A. In this case, activity B has an LS of 6 and activity C has an LS of 5. The earliest LS is therefore 5, and so LS of activity A is 5.

A

B

C

5

3

4

0

5

5

8

5

9

0

5

6

9

5

9

Step 7.

What is the float? Take LF – EF (or LS – ES) for each of the activities.

A

B

C

5

3

4

0

5

5

8

5

9

0

5

6

9

5

9

0

1

0

So the float of B is 1, and the float of A and C are 0. Therefore A and C are on the critical path.

If you were trying to shorten the length of the project you could do it by crashing or adding more resources to a specific activity to get it done in less time. Or you could fast track an activity so that if you have two activities that normally come one right after the other like this:

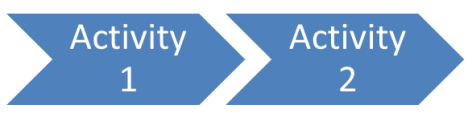
you can take the second activity and fast track it by starting it BEFORE the first activity is completed.


In this case, you don’t have increased cost like you do when you are crashing an activity, but you do have increased risk based on the need to coordinate the activities being done partly at the same time. The only time when fast tracking might cost additional resources would be if the people who are doing activity 1 and activity 2 are the same people.

In any case, you can see how the critical path lets you know what activities are critical to maintain the planned schedule, but it also shows you where you can compress the schedule most effectively, and gives you indications as to where the higher risk areas will be in the schedule. Those activities that have several predecessor activities that MUST be done first will need more scrutiny than those that only have one predecessor, for example.

This concludes the review of the 7 management tools that are used in Six Sigma. They are not exclusively used in Six Sigma, of course, but they are tools for brainstorming, for analyzing, and for planning a Six Sigma project.

Six Sigma Green Belt–Management Tool #6: Process Decision Program Charts (PDPC)


In a way, a process decision program chart is similar to failure mode effects analysis in that it tries to map out the ways things can wrong, but not with respect to the design, but with respect to the process itself. It is a way of mapping out countermeasures to those things that can go wrong, and so could be considered a tool of risk management.  Risk management is especially important when projects are complex and the schedule constraint is tight (i.e., no delays permissible).

Here’s the procedure.   Please note that this tool requires the output of Management Tool #2: Tree Diagrams which was covered in a previous post.

Step Description
1. Create Tree Diagram of Plan Take the high-level objective (first level), list the main activities required to reach that objective (second level), and then under each activity list the tasks required to accomplish those activities (third level).
2. Brainstorm Risks Brainstorm and figure out what could go wrong for each of the third-level tasks that could prevent them from being accomplished.
3. Rank Risks Rank the risks created in step 2 according to probability and impact. Eliminate those risks if the probability is low and the impact is negligible, or both. Therefore you are left with only those risks which medium to high probability and medium to high impact on the project.
4. List Risks List all remaining risks after step 3 under the tasks they are associated with, creating a fourth level on the tree diagram created in step 1.
5. Brainstorm Countermeasures Brainstorm and figure out for each risk what could be done to either a) prevent it from happening or b) remedy the situation if it does occur.
5. List Countermeasures List all countermeasures underneath the risks they are associated with, creating a fifth level on the tree diagram modified in step 4.
6. Rank

Countermeasures

Rank the countermeasures created in step 5 according to their time, cost, and ease of implementation. After deciding the criteria, decide which countermeasures are practical and mark those with an O, and mark those that are impractical with an X.

Here’s an example taken from ASQ’s Learn About Quality feature regarding this tool. This is taken as an example of a medical group that is trying to improve the patient care for those patients that have chronic illnesses like diabetes.

You can see the first level objective, the second level activities, and the third level tasks.

On the fourth level, you see the example of two tasks that have listed the risks associated with them that might prevent those tasks being carried out. The fifth level has countermeasures listed to prevent those risks from occurring. The practical countermeasures are marked with an O and the impractical ones are marked with an X.