

In John Stenbeck’s book “PMI-ACP and Certified Scrum Professional Exam Prep and Desk Reference”, he creates an “agile project management process grid” which describes 87 processes used in agile project management. These processes are divided into five process groups (Initiate, Plan, Iterate, Control, and Close), which are analogous to the five process groups in traditional project management, and seven knowledge areas which can be mapped, more or less, onto the ten knowledge areas in traditional project management.
Here is an example of the tool used to improve performance on agile project. The stories in the blue area are in the backlog, and have not yet been started. The stories in the purple area are started, but not yet completed, and are therefore Works In Progress or WIP. The stories in the pink area are completed. (NOTE: the diagram uses the concept of features rather than stories, but the concept is the same.)
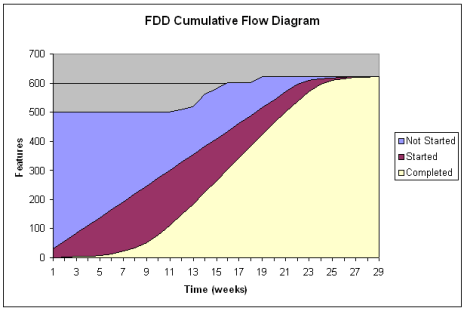
The WIP at any point in time can be measured by the number of stories between the top of the purple area to the bottom of the purple area. So, for example, on week 11, the amount of stories that are WIPs is 300 – 100 = 200. You can imagine that, in between weeks 9 and 11, the agile project manager looked at the CFD diagram and saw that the WIP was getting to be undesirably large. Then measures were taken to reduce the amount of WIP (see previous post) and then the WIP narrows significantly in the following weeks. Reducing the WIP, by Little’s Law (see previous post), has a corresponding effect on cycle time. So a Cumulative Flow Diagram gives a transparent picture on the progress of the project.
The next post will cover the next knowledge area covered repeatedly during iterations, namely, value-driven delivery (i.e., quality).
Filed under: Uncategorized |

Leave a comment