

This post is one of several describing a single process that is essential to controlling an agile project, namely Earned Value Management. It is labeled 2.13 on the agile project management process grid because it covers the second knowledge area of “Value Driven Delivery”, which monitors how the project manages the constraints of time, cost, scope, and value; it also is the thirteenth process in that knowledge area. In particular, it is one of the processes done during the “Control” process group in any given project.
This post is one of several devoted to the process 2.13 Earned Value Management. The last post covered the processes of Earned Value Management, and how these are differ in waterfall and agile projects.
How do you report on EVM in an agile environment? That is the subject of the current post? Remember, the key quantities to report on are:
- actual cost (AC), which monitors the actual cost of work done;
- planned value (PV), which monitors the value of work that is planned or scheduled to be done, and thus is a measure of time or schedule;
- earned value (EV), which monitors the estimated cost of the work actually accomplished or completed, and thus is a measure of the scope accomplished.
A burn-up chart is a chart which shows the cumulative progress on a project. Normally, it has the iteration number on the x-axis and the number of story points completed on the y-axis.
The total release scope is placed on a line at the top, as in this example from Pawel Brodinski’s blog on Software Project Management.
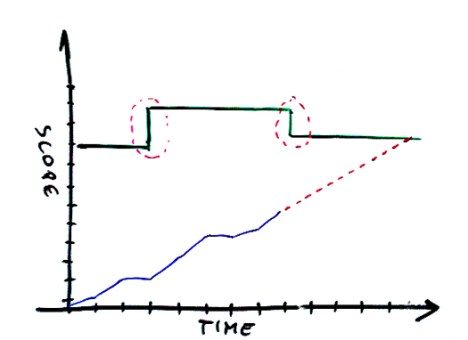
This is important because it shows if there are any changes in scope, as happens in the example show above. The red dotted line shows the IDEAL or planned progress towards the goal; it is the equivalent of Planned Value. The blue line shows the actual progress towards the goal; it is the equivalent of Earned Value. Notice that the blue line goes in kind of a stair-step fashion. That is because progress is not counted as being earned until stories are completed. There is no partial credit given for stories partially completed on the earned value line! So you add an actual cost line (not shown above), which would show one day’s worth of work on a particular story even if the story were not completed. It is a smoother line because it shows that work is constantly being done by the team, which shows up on the blue earned value line at those points where stories are actually completed.
So the EVM/burn-up chart shows several points of information:
- Has the release scope changed?
- What is the ideal progress towards the release scope goal?
- What is the actual progress towards the release scope goal in terms of story points completed?
- What is the actual progress towards the release scope goal in terms of days of work expended?
How do you gather the data for an EVM/burn-up chart? That is the subject of the next post.
Filed under: Uncategorized |

Leave a comment