Agile PM Process Grid-5.12 Variance and Trend Analysis


In John Stenbeck’s book “PMI-ACP and Certified Scrum Professional Exam Prep and Desk Reference”, he creates an “agile project management process grid” which describes 87 processes used in agile project management.   These processes are divided into five process groups (Initiate, Plan, Iterate, Control, and Close), which are analogous to the five process groups in traditional project management, and seven knowledge areas which can be mapped, more or less, onto the ten knowledge areas in traditional project management.

I am now covering processes that are performed during the Control process group of an agile project.   Remember, after the Planning process group, an agile project does not go in a linear fashion from Iterate to Control to Close; rather, it cycles from Iteration to Iteration with periodic checkpoints (many times at the end of an iteration cycle) where you Control or make changes to a project to make sure it gets back on track.   Or sometimes, you even change the track itself if there is a change in the requirements.

In the past set of posts, I have covered those processes done in the Control process group that relate to the fourth knowledge area of Team Performance.   Today I start covering  processes related to Risk Management:

  • 5.11  Obstacle Removal
  • 5.12  Variance and Trend Analysis
  • 5.13  Escaped Defects

The first of these is 5.11 Obstacle removal, which I covered in the previous post; I cover 5.12 Variance and Trend Analysis.

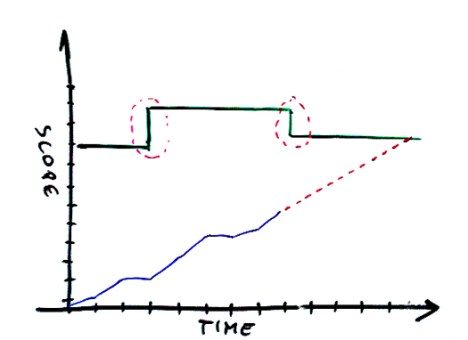
Variance analysis calculates the difference between actual and estimated levels of performance and analyzes the cause or causes of the differences in order to be able to correct them.

Trend analysis collects data points, including those concerning the level of performance, and analyzes them to detect patterns that may predict the future trajectory of these data points.

Do you remember the Christmas Story by Charles Dickens, where Ebenezer Scrooge was visited by the ghosts of three spirits:   the Ghost of Christmas Past, the Ghost of Christmas Present, and the Ghost of Christmas Future?

In a project, a project manager or scrum master is also haunted by three ghosts, but in this case they are called the Ghost of Defects Past, the Ghost of Defects Present, and the Ghost of Defects Future.

The Ghost of Defects Past is covered in the next process 5.13 Escaped Defects.   This post deals with the other two Ghosts:   the Ghost of Defects Present, and the Ghost of Defects Future.

The Ghost of Defects Present is detected through variance analysis, and the measures taken to exorcise this ghost are called corrective actions.

The Ghost of Defects Future is detected through trend analysis, and the measures taken to exorcise this ghost are called preventive actions.

The best tool to use for variance and trend analysis in agile projects would probably be the burn-down chart.   The burn-down chart shows both the team’s planned and actual work, so it is easy to compare the actual work delivered against estimated work planned.

We will discuss the process 5.14 in the next post on Escaped Defects.


The next process 5.12 Variance and Trend Analysis will be discussed in the next post.


Agile PM Process Grid–5.11 Obstacle Removal


In John Stenbeck’s book “PMI-ACP and Certified Scrum Professional Exam Prep and Desk Reference”, he creates an “agile project management process grid” which describes 87 processes used in agile project management.   These processes are divided into five process groups (Initiate, Plan, Iterate, Control, and Close), which are analogous to the five process groups in traditional project management, and seven knowledge areas which can be mapped, more or less, onto the ten knowledge areas in traditional project management.

I am now covering processes that are performed during the Control process group of an agile project.   Remember, after the Planning process group, an agile project does not go in a linear fashion from Iterate to Control to Close; rather, it cycles from Iteration to Iteration with periodic checkpoints (many times at the end of an iteration cycle) where you Control or make changes to a project to make sure it gets back on track.   Or sometimes, you even change the track itself if there is a change in the requirements.

In the past set of posts, I have covered those processes done in the Control process group that relate to the fourth knowledge area of Team Performance.   Today I start covering  processes related to Risk Management:

  • 5.11  Obstacle Removal
  • 5.12  Variance and Trend Analysis
  • 5.13  Escaped Defects

The first of these is 5.11 Obstacle removal, which I cover today.

Obstacle Removal

What are the categories of obstacles that can threaten a team’s ability to deliver the iteration goal at the end of the iteration?

  • Technical challenges–usually the first category of obstacles the team will consider when discussing risk management
  • Stakeholders–the customer or senior management may want to change the iteration goal
  • Functional manager–may reassign members of an agile team
  • Communications–may lead to both process and product impediments
  • Competitor product release
  • Changing customer preferences
  • Regulatory changes

Organic risk management is done in conjunction with the daily stand-up meetings–“organic” in this case means “done as a part of agile project management processes.”   Overt risk management is done using traditional project management techniques (risk register, etc.).

The next process 5.12 Variance and Trend Analysis will be discussed in the next post.


Agile PM Process Grid-4.10 Velocity


In John Stenbeck’s book “PMI-ACP and Certified Scrum Professional Exam Prep and Desk Reference”, he creates an “agile project management process grid” which describes 87 processes used in agile project management.   These processes are divided into five process groups (Initiate, Plan, Iterate, Control, and Close), which are analogous to the five process groups in traditional project management, and seven knowledge areas which can be mapped, more or less, onto the ten knowledge areas in traditional project management.

I am now covering processes that are performed during the Control process group of an agile project.   Remember, after the Planning process group, an agile project does not go in a linear fashion from Iterate to Control to Close; rather, it cycles from Iteration to Iteration with periodic checkpoints (many times at the end of an iteration cycle) where you Control or make changes to a project to make sure it gets back on track.   Or sometimes, you even change the track itself if there is a change in the requirements.

In any case, I have covered those processes in the Control process group that relate to the first three knowledge areas of External Stakeholders Engagement, Value-Driven Delivery, and Adaptive Planning.   Now I am covering the two processes that relate to the fourth knowledge area of Team Performance.   In the last post, I covered 4.9 Task Board/Burn Down Chart Updates, and in this post I cover 4.10 Velocity.

Velocity is defined as the number of story points completed by the team during the iteration.

During the planning phase, an estimate of team velocity is used which is called forecast velocity.    In order to create this estimate, some assumptions must be made in order to make basic calculations, such as:

  • how many members will be on the development team
  • how many weeks there will be in the iteration
If you multiply these two, you will have the weeks of ideal time available during an iteration.   Then you estimate the number of days or weeks each story will take to complete, and you will have an estimate of how long the project will take to complete.
In the Control process group, however, you calculate the actual velocity based on the number of actual stories completed in each iteration.   By the fourth or fifth iteration, the velocity should stabilize.    This allows a more reliable estimate as to whether any given feature can be completed by a certain date.    This allows the work to be aligned to the release plan.
This completes the processes related to “Team Performance” done in the Control process group.   The next post will start discussing the processes related to Risk Management:
  • 5.11  Obstacle Removal
  • 5.12  Variance and Trend Analysis
  • 5.13  Escaped Defects


Agile PM Process Grid-4.9 Task Board/Burn Down Chart Updates


In John Stenbeck’s book “PMI-ACP and Certified Scrum Professional Exam Prep and Desk Reference”, he creates an “agile project management process grid” which describes 87 processes used in agile project management.   These processes are divided into five process groups (Initiate, Plan, Iterate, Control, and Close), which are analogous to the five process groups in traditional project management, and seven knowledge areas which can be mapped, more or less, onto the ten knowledge areas in traditional project management.

I am now covering processes that are performed during the Control process group of an agile project.   Remember, after the Planning process group, an agile project does not go in a linear fashion from Iterate to Control to Close; rather, it cycles from Iteration to Iteration with periodic checkpoints (many times at the end of an iteration cycle) where you Control or make changes to a project to make sure it gets back on track.   Or sometimes, you even change the track itself if there is a change in the requirements.

In any case, I have covered those processes in the Control process group that relate to the first three knowledge areas of External Stakeholders Engagement, Value-Driven Delivery, and Adaptive Planning.   Now I am covering the two processes that relate to the fourth knowledge area of Team Performance, namely 4.9 Task Board/Burn Down Chart Updates, and 4.10 Velocity.

Task Board or alternatively Kanban Boards were set up in process 3.16 Task/Kanban Boards and Burn Down Charts were set up in process 3.15 Burn Down Charts.   This process is where you periodically monitor and, if necessary, take action based on the information in those charts.

What is the primary duty of the task board or burn-down chart?    According to John Stenbeck, it is to enable team synchronization.   It must have the following characteristics:

  • visible–the information must be able to be understood in sixty seconds or less
  • flexible–the information must be able to be used by ALL team members
  • accurate–the information must reflect as closely as possible the current state of the project

The visible characteristic is important because it is more visual than verbal–more information can be processed this way.   This is especially important for teams which have international members and for whom English is not their first language.   The “sixty second” rule is not John Stenbeck’s, but one I learned from a previous boss.   However, I have followed it through my career and it has served me in good stead.

Every team member needs to be able to gain something from the task board or kanban chart; that’s where the flexible part comes in.   And finally, accurate information in the sense of reflecting the current state of the project, is important so any action that is taken in response to that information will be effective.

As opposed to some control processes that are done at the END of an iteration cycle, this process is one that should occur on a DAILY basis, no matter the length of the cycle.   It should answer two basic questions:

  1. where are we NOW?
  2. where are we going in the near future?

There are other charts, such as burn-up charts, which can tell where the team is going in the medium and long term; the burn-down chart is for what’s happening NOW.

The next control process that affects Team Performance is 4.10 Velocity, and that is the subject of the next post.


Agile PM Process Grid–3.20 Information Radiators Monitoring


This post covers the process that monitors during the Control process group the information radiators set up in process 6.4 Information Radiator in the Planning process group.

Those things which are monitored through information radiators during the Control process group include:

  • critical issues
  • status of each backlog item
  • status of testing

How useful is the information in the information radiators?   Obviously in order to be useful it might be accurate and timely.  The team should observe how often stakeholders are viewing the information and whether the information prompts insightful dialogue, even asking the stakeholders which pieces of information in the information radiators they end up following most closely.

By prompting dialogue with the stakeholders, information radiators can deliver both control AND flexibility on the project level.

The next post covers 4.9 Task Board/Burn Down Charts Updates, a process done during the Control process group based on the processes 3.15 Burtn Down Charts and 3.16 Task/Kanban Boards set up in the Iterate process group.


Multilingual Learning Plan–March 2016


On Friday, I went to a local bookstore and got Benny Lewis’ book Fluent in 3 Months.   I decided to take the day off in terms of my usual blogging about project management, and set forth my goals in general and for the next month in terms of language learning.

This is because over the weekend I was reading Fluent in 3 Months, and after reading the chapter on why people should be endeavoring to be fluent in multiple foreign languages, he starts the next chapter by challenging people to set actual goals that are specific and to post those goals in a public place (like a blog post) in order to make oneself accountable for them.

  1.  Multilingual level goals

I am fluent in five foreign languages if you measure that fluency in terms of B1 level or higher on the Common European Language Framework.

So for those languages, I have put my goal to become one level higher by 2017.

For the languages I have been studying but which I have not achieved fluency, I am also putting my goal to become one level higher by 201

For those languages I have not studied before, but which I want to study in 2016, I’m putting the target as BEGINNER (A1).

Level Goal Language
C2–Mastery
C1–Advanced Japanese, French
B2—Upper Intermediate Chinese, German, Spanish
B1–Intermediate Italian, Portuguese
A2–Elementary Arabic
A1–Beginner Korean, Dutch, Hindi, Irish

Although I put all languages on my level goal list, certain languages have higher priority level, which translates into studying frequency.   Also, although my ultimate goal is to speak with native speakers, my intermediate goal  is to use textbooks in order to prepare for proficiency tests.

2.  Multilingual goals–method, priority level

Language Goal (Test/Textbook) Priority
Japanese JLPT N2, Tobira High
French DALF C1/C2 Medium
Chinese HSK 4 High
German ZDfB (B2) Medium
Spanish DELE B2 Medium
Italian Italian Now Medium
Portuguese Portugues Actual Medium
Arabic Living Language, Rosetta Stone 3 Low
Korean Integrated Korean Beginning 1 Low
Dutch Living Language Beginner Low
Hindi Beginning Hindi, Rosetta Stone 1 Low
Irish Living Language Essential Low

3.   Multilingual goals–March 2016

Here’s my goals for March 2016.

Language Goal (Test/Textbook)
Japanese–DONE! Tobira Ch. 1; Kanji Kentei review levels 10, 9 (school grades 1)
French–DONE! Duolingo (complete entire skill tree)
Chinese–DONE! 2x/week Skype lesson with eChineseLearning, HSK 4 listening comprehension test #1 prep
German Duolingo (skill tree level 4 skills 1-10)
Spanish–DONE! Duolingo (complete entire skill tree)
Italian Duolingo (complete skill tree level 3)
Portuguese Duolingo (complete skill tree level 3)
Arabic–DONE! Mastering Arabic ch. 1
Korean Integrated Korean Beginning 1 (reading Hangul)
Dutch Living Language Beginner (pronunciation guide)
Hindi Beginning Hindi (reading Hindi script)
Irish Living Language Essential ch. 1

Those languages which are in bold are high priority, those that are in regular font are medium priority, and those which are in italics are low priority.

Let’s see what I accomplish in the month of March!

Agile PM Process Grid-2.13 Earned Value Management (5)


This post is one of several describing a single process that is essential to controlling an agile project, namely Earned Value Management.   It is labeled 2.13 on the agile project management process grid because it covers the second knowledge area of “Value Driven Delivery”, which monitors how the project manages the constraints of time, cost, scope, and value; it also is the thirteenth process in that knowledge area.   In particular, it is one of the processes done during the “Control” process group in any given project.

This post is the last of five describing the process 2.13 Earned Value Management.    The posts have covered

  • the similarities between Earned Value Management on a traditional, waterfall project, and an agile project
  • the differences between Earned Value Management on a traditional, waterfall project, and an agile project
  • the way that Earned Value Management is measured in an agile project using traditional reporting metrics of Earned Value (EV), Planned Value (PV), and Actual Cost (AC)
  • the way that Earned Value Management is reported on an agile project

Today’s post covers some non-traditional reporting metrics for Earned Value Management in an agile project environment.

Using the three building blocks mentioned above, you can get the following four metrics that show how a project is doing with respect to the schedule and budget:

Formula Equation
Schedule Variance (SV) SV = EV – PV
Schedule Performance Index (SPI) SPI = EV / PV
Cost Variance (CV) CV = EV – AC
Cost Performance Index (CPI) CPI = EV / AC

Schedule Variance and Schedule Performance Index both tell you the same thing, that is, whether the project is on time or not, but they do it with different sets of numbers.    An SV that is positive means that the project is ahead of schedule (i.e., you’re completing more work than planned), and an SV that is negative means that the project is behind schedule (i.e., you’ve not completed all the work you planned).   An SPI tells you this as well, but the SPI that is greater than 1 means that the project is ahead of schedule, whereas an SPI that is less than 1.0 means that the project is behind schedule.

The Cost Variance and Cost Performance Index in a similar way show whether a product is under budget (with a positive CV or a CPI that is greater than 1.0) or over budget (with a negative CV or a CPI that is less than 1.0).   Those are the traditional EVM metrics, that can be used in an agile project as well.

Here are some EVM metrics that are strictly geared for agile projects.    They are based on the assumption that progress should be measured against the release level (not the iteration level), and that A-EVM calculations are done at the end of each iteration.

Measure EVM Definition Formula
Performance Measure

Baseline (PMB)

Total number of story points planned for a release (SP) PMB = SP


Schedule Baseline (SB) Total number of iterations (IP) multiplied by iteration length (L) SB = IP * L
Planned Percent

Complete (PPC)

Number of the current iteration (i) divided by the total number of planned iterations (lP) PPC = i/ lP
Actual Percent

Complete (APC)

Number of iteration story points completed (s) divided by the total number of story points planned (SP) APC = s/

However, these calculations are not universally accepted within the agile community, which just goes to show that agile project management is definitely a work in progress.

The next post will discuss the process 3.20 Information Radiators Monitoring.


Agile PM Process Grid-2.13 Earned Value Management (4)


This post is one of several describing a single process that is essential to controlling an agile project, namely Earned Value Management.   It is labeled 2.13 on the agile project management process grid because it covers the second knowledge area of “Value Driven Delivery”, which monitors how the project manages the constraints of time, cost, scope, and value; it also is the thirteenth process in that knowledge area.   In particular, it is one of the processes done during the “Control” process group in any given project.

This post is one of several devoted to the process 2.13 Earned Value Management.    The last post covered how to track and report Earned Value Management.   This post will cover the issue of the granularity of reporting.

The biggest difference between calculating planned value in traditional and agile project management is that in traditional project management, planned value is usually calculated as the cumulative value of the work that is scheduled or planned to be completed by a certain point in the project.    The planned value at the end of the project, for example, will just be the amount of the budget of the entire project.

This is true in principle in agile project management, except that the value is calculated, not in terms of dollars, but in terms of the number of stories completed.   This number of stories complete is based on sizing, an agile estimation technique which gives the relative size of the effort given to complete a given story.    In traditional PM, the estimate is based on the absolute dollar value of the work involved in completing a given work package.

The planned value can be based on the roadmap, the release, or a given subset of iterations.   What level of granularity should be chosen?

Just remember that the greater the level of detail of the estimate of planned value, the greater amount of resources required to create that estimate.

A Parable on Estimation:  the Cartographer’s Tale

This takes me to a parable, taken from a short story by Jorge Luis Borges in the collection Dreamtigers.   There is a village in Germany which is well-known as having one of the most ambitious set of cartographers in the country.   They created a map which had a 10,000:1 scale.   They decided to try for 5,000:1 scale map.   They succeeded, and went to go for an even smaller-scale map. 

Eventually, they told the mayor of the town that they were going to go for the ultimate map, a map that was on a 1:1 scale!    They told the mayor that such a cartography project had never been attempted before, and, if successful, would bring tourists from around the country to view it!

The mayor agreed and put all the town’s resources into the creation of the ultimate map.   Many projects that would have been carried out relating to the upkeep of the town were put on hold, in anticipation of the future revenue that the creation of this map would bring.    The mayor said that the map would be revealed to the world at an unveiling ceremony to be held at the Town Hall!    He invited dignitaries from around the country to be there for the ceremony.

On the day the map was created, however, the cartographers came to the mayor with distressing news!    The map was understandably so large that it could not be folded into a shape compact enough for it to even get out of the door of the cartographer’s building.   With no map to show for all the effort, the mayor was embarrassed, and the town’s finances were now known to be in a shambles because the resources had all been used up for the creation of a map which was practically useless.    That night, the cartographer’s building, and the map inside it, burned up in a mysterious fire.   Whom it was set by was never revealed …

Okay, I embellished the short story a bit for dramatic purposes, but the meaning is clear.   The amount of resources put into the map exceeded the actual value that the map was creating.   The example of the map is a reductio ad absurdum intended to show that the VALUE of the estimate to the project must exceed the VALUE required to create it.   So if you only need to go to the level of the release plan, or even a certain subset of iterations that achieve a certain milestone, so be it.   That’s what the level of granularity should be!

Since the measure of planned value is based on the relative value of the size of the effort required, rather than the absolute (dollar) value of the effort, the way that earned value management is expressed can differ between traditional and agile management.

There are other A-EVM measurements than Earned Value (EV), Planned Value (PV), and Actual Cost (AC), and these are discussed in the next post.


Agile PM Process Grid–2.13 Earned Value Management (3)


This post is one of several describing a single process that is essential to controlling an agile project, namely Earned Value Management.   It is labeled 2.13 on the agile project management process grid because it covers the second knowledge area of “Value Driven Delivery”, which monitors how the project manages the constraints of time, cost, scope, and value; it also is the thirteenth process in that knowledge area.   In particular, it is one of the processes done during the “Control” process group in any given project.

This post is one of several devoted to the process 2.13 Earned Value Management.    The last post covered the processes of Earned Value Management, and how these are differ in waterfall and agile projects.

How do you report on EVM in an agile environment?   That is the subject of the current post?   Remember, the key quantities to report on are:

  • actual cost (AC), which monitors the actual cost of work  done;
  • planned value (PV), which monitors the value of work that is planned or scheduled to be done, and thus is a measure of time or schedule;
  • earned value (EV), which monitors the estimated cost of the work actually accomplished or completed, and thus is a measure of the scope accomplished.

A burn-up chart is a chart which shows the cumulative progress on a project.   Normally, it has the iteration number on the x-axis and the number of story points completed on the y-axis.

The total release scope is placed on a line at the top, as in this example from Pawel Brodinski’s blog on Software Project Management.

burnup2

This is important because it shows if there are any changes in scope, as happens in the example show above.   The red dotted line shows the IDEAL or planned progress towards the goal; it is the equivalent of Planned Value.    The blue line shows the actual progress towards the goal; it is the equivalent of Earned Value.    Notice that the blue line goes in kind of a stair-step fashion.   That is because progress is not counted as being earned until stories are completed.    There is no partial credit given for stories partially completed on the earned value line!   So you add an actual cost line (not shown above), which would show one day’s worth of work on a particular story even if the story were not completed.   It is a smoother line because it shows that work is constantly being done by the team, which shows up on the blue earned value line at those points where stories are actually completed.

So the EVM/burn-up chart shows several points of information:

  • Has the release scope changed?
  • What is the ideal progress towards the release scope goal?
  • What is the actual progress towards the release scope goal in terms of story points completed?
  • What is the actual progress towards the release scope goal in terms of days of work expended?

How do you gather the data for an EVM/burn-up chart?   That is the subject of the next post.


Agile PM Processes–2.13 Earned Value Management (2)


This post is one of several describing a single process that is essential to controlling an agile project, namely Earned Value Management.   It is labeled 2.13 on the agile project management process grid because it covers the second knowledge area of “Value Driven Delivery”, which monitors how the project manages the constraints of time, cost, scope, and value; it also is the thirteenth process in that knowledge area.   In particular, it is one of the processes done during the “Control” process group in any given project.

This post is one of several devoted to the process 2.13 Earned Value Management.    The last post covered the fundamental building blocks of Earned Value Management, and how they are the same in both waterfall and agile projects.   The process of earned value management, however, differs in waterfall and agile projects, as can be seen from the chart below, where EVM stands for Earned Value Management in a traditional or waterfall environment, and A-EVM stands for Agile Earned Value Management.

EVM A-EVM
1.  Define Project Scope 1. Create Roadmap & Release Plans
2.  Assemble Team 2. Assemble Team
3.  Decompose Work 3. Document Stories
4. Outline Project Schedule 4. Define Releases & Iterations
5. Estimate Work Package Budgets 5. Estimate Story/Feature Budgets
6. Specify Time-Phased Budget 6. Specify Iteration Budgets

The only process the two have in common is the second, Assemble Team.   When I first saw this chart in John Stenbeck’s book, I was wondering why it was even there because it is considered to be a human resources process in the PMBOK Guide.   I believe it is there because John Stenbeck wanted to emphasize that the process of earned value management should be a team effort.

How do you show EVM in an agile environment?   That is the subject of the next post.